Summary: Photometric redshifts have been generated for the galaxies in the D3_24 images described here. |
Photometry:
SExtractor was run on the D3_24_I band image
to produce a catalog and a
segmentation image.
The SExtractor parameter file that was used
can be found here to
produce a catalog and a segmentation image.
The x and y positions and the segmentation images
were passed on to mgwynphot. This
program does photometry through a circular
aperture (1 arcsecond radius) which excludes
pixels belonging to neighbouring galaxies as determined
by the SExtractor segmenation image. The same
aperture is used in all bands. Note that although
this method produces fairly accurate colours -- the
small aperture means less sky noise -- the magnitudes
are not a good estimate of the total magnitude of the
galaxy.
Photometric Redshifts: Photometric redshifts were measured with gwynz which works with the template fitting method.
|
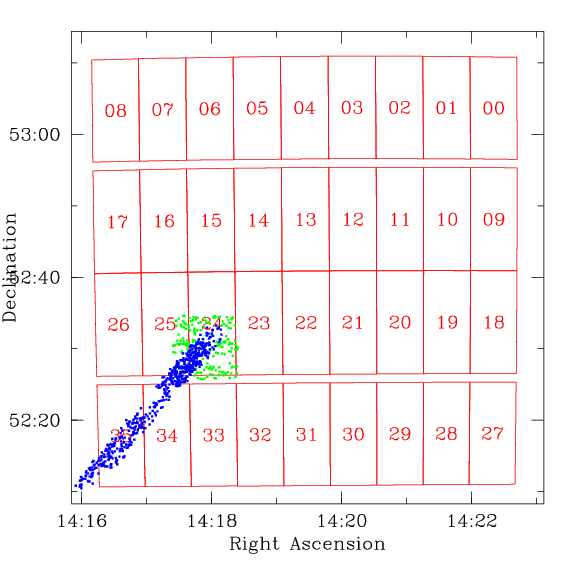
![]() Spectroscopic redshifts from the CFRS and DEEP were retrieved from the web. The assembled redshifts can be found here. The figure at right shows the configuration. The red lines show the outlines of the MegaCam CCD's. The blue dots and green dots show the location of galaxies with spectroscopic redshifts from DEEP and CFRS respectively. The DEEP+CFRS catalog was cross referenced with the photometric redshift catalog. For each DEEP or CFRS object, the closest and second closest CFHTLS was found. If the closest CFHTLS object was within 2 arcseconds it was deemed a good match unless there was a second object within 4 arcseconds (this second criteria was to avoid confusion in the case of two nearby galaxies). |
![]() |
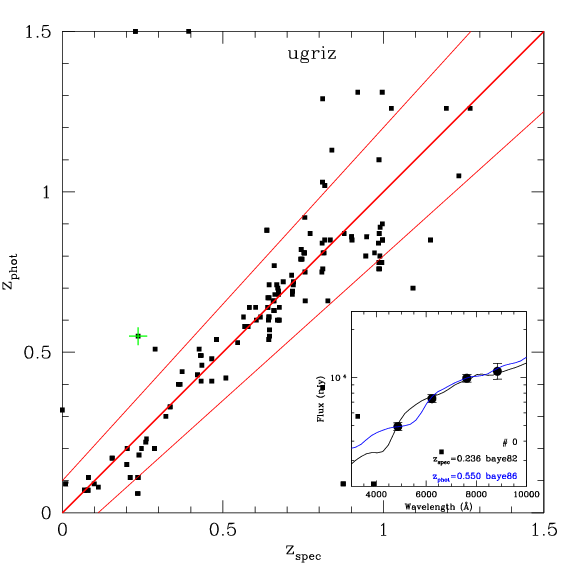
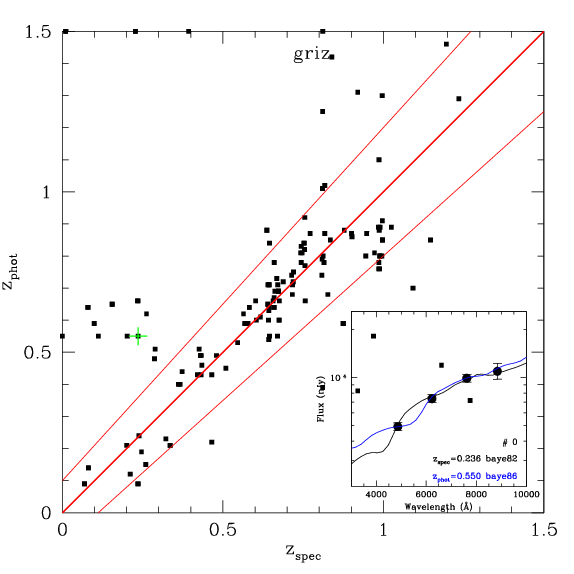
![]() The two figures at right show z_phot vs z_spec for the D3_24field. The upper one show the results using all five ugriz filters (where available). The lower one (not quite as satisfactory) shows the results only using the griz filters. The heavy red line shows the z_phot=z_spec relation. The lighter lines show +/- 10% in (1+z). A green cross highlights one of the galaxies.
Inset into the lower right
corner of each figure is a plot of the spectral energy distribution (flux
vs. wavelength) of this galaxy. In this inset, the black dots
with error bars show the
ugriz-band data converted to an SED and the blue line shows the best fitting template,
determined by the photometric redshift chi-squared minimization process.
The black line shows the best
fitting template, but this time constrained to be at the spectroscopic redshift.
|
![]() ![]() |
The match between z_phot and z_spec is quite good for the ugriz data and fairly good when only the griz bands are used. The match is significantly better than the pre-Elixir version of these graphs as shown on this webpage, as predicted by simulations. |
The catalogs There are two catalogs. The first (D3.24.zed) contains photometric redshifts. The second (D3.24.abs) also contains absolute magnitude information The catalogs are in ASCII format; the first line contains the column headings:
|
Back to Stephen Gwyn's CFHTLS pages
Send comments/suggestions/problems to