D3_24 Elixir data

Summary:
Recently released Elixir-processed data for the has been examined. The data for CCD24 of the D3 field has been stacked. UGRIZ images are presented:
The first release of Elixir-processed data occured on the 15th of January. As a quick check on the quality/homogenity of the data, and the AstroGwyn/PhotGwyn/SWarp pipeline, the I data for one of the CCD's was examined and stacked.

The data were retreived from the CADC archive. For each multi-extension FITS image, the CCD24 (extension 25) was extracted. Most images are of high quality. A list of exceptions can be found here Typical seeing is about 0.9 arcseconds. Fringing is invisible in the I band and difficult to detect in Z.

The total number of usuable exposures and total exposure times is given in the following table:

BandNumber of
exposures
Total Exposure
Time (secs)
U 2 1320
G 35 6300
R 6414760
I14941780
Z 20 3600

The AstroGwyn astrometric calibration pipeline was then run on the images. The first step is to run SExtractor on each image. The parameters are set so as to extract only the most reliable objects (5 sigma detections in at least 5 pixels).

For the first band to be reduced (I) these image catalogs were matched with the USNO A2 catalog to provide an initial astrometric solution. Elixir provides an accurate 1st order solution. AstroGwyn improves on this to provide an 2nd order solution with typical residuals of 0.5 arcseconds with respect to the UNSO. In order to register the images a internal astrometric catalog was generated by cross-referencing the catalogs for all the individual images, identifying objects common to multiple images, and averaging the positions.

For the other bands, the image catalogs are first matched to the USNO A2 to provide a rough WCS and then matched to a catalog generated using the first image so as to precisely register the different bands. The final astrometric calibration has an internal uncertainty of about 0.05 arcseconds and an external uncertainty of 0.3 arcseconds.

The PhotGwyn photometric calibration system takes the object catalog from each image and cross-references them. For every pair of images, the difference in measured magnitude for objects common to both images is computed. The median difference of all these magnitude differences gives photometric offset between the two images. The Elixir headers give photometric calibrations based on standard star observations during the observing run. These calibrations are valid only under good observing conditions of course. PhotGwyn plots the difference between the Elixir zero-point and the zero-point derived from the offsets. When this difference is large, this indicates the night the data was taken was not photometric. Systematic changes over the night indicate a higher than average extinction coefficient. PhotGwyn makes it possible to identify images taken under photometric conditions and propagate the photometric zero-point to images taken under non-photometric conditions.

SWarp Written by Emmanual Bertin of Terapix combines the images, taking into account the astrometric distortion corrections and the photometric calibration.

The results, a stacked images and weight maps, are given here below. They are password protected.

The images are calibrated so that they have an AB zeropoint of 30. That is to say, for each image:
  magAB=-2.5 * log10(flux in DU) + 30

This is based on the Elixir calibration (which may be slightly in error, see below).

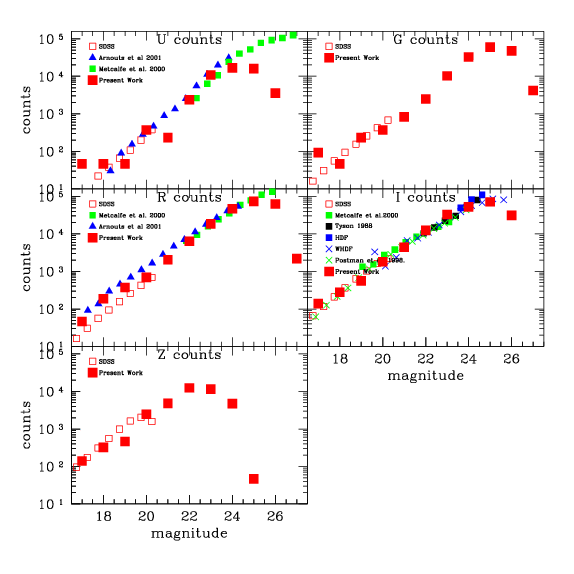
The figure at right shows the galaxy number counts for the D3_24 in the UGRIZ bands, counts for this image, together with several other counts from the literature (objects per square degree per unit magnitude) In the case of the I counts, it is easy to see that the counts agree closely with the literature data. For the other bands, the SDSS counts are only available at fairly bright magnitudes. Here, the D3 counts have large uncertainties due to stellar contamination, although a quick star-galaxy separation scheme based on half light radius has been applied. Also because only one CCD is being considered here, the Poisson errors are large. The figure shows (within the errors) relative good agreement between the counts.

It is slightly difficult to assign limiting magnitudes. However, very rough estimates based on the turnover in the counts are given in the following table:
BandLimiting
Magnitude
U 23.0
G 24.0
R 24.0
I 24.0
Z 22.0

Note that the estimate of the U band limiting magnitude is almost certainly in error. There were only two U band images taken so the faint end U band number counts are dominated by cosmic rays.

The SDSS number counts come from Yasuda et al. 2001 The data for other sources comes from Nigel Metcalfe's number count page


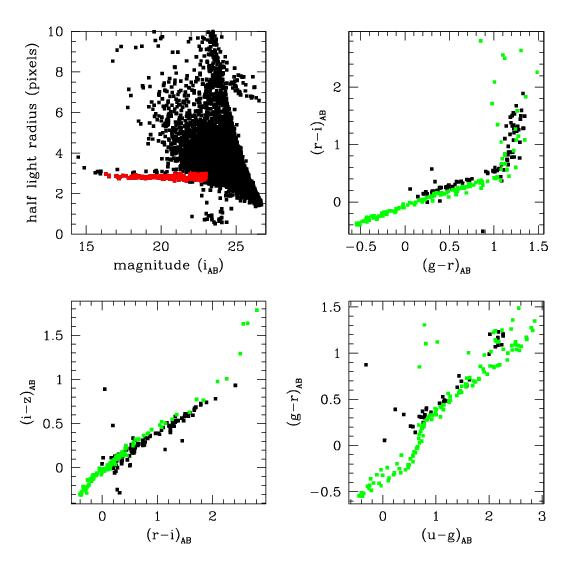
The figures at right show the colours of stars in the D3_24 field. The stars were identified by plot half-light radius against magnitude, as shown in the top left plot. The stellar locus is easily identified and is shown in red.

The other plots show show colour-colour plots for stars in the MegaPrime ugriz system. The green dots represent the results of multiplying the Pickles 1998 spectra by the MegaCam filter curves described from here. The black dots show the colours of stars in the D3_24 field. The two sets match fairly closely, but some small offsets are visible.


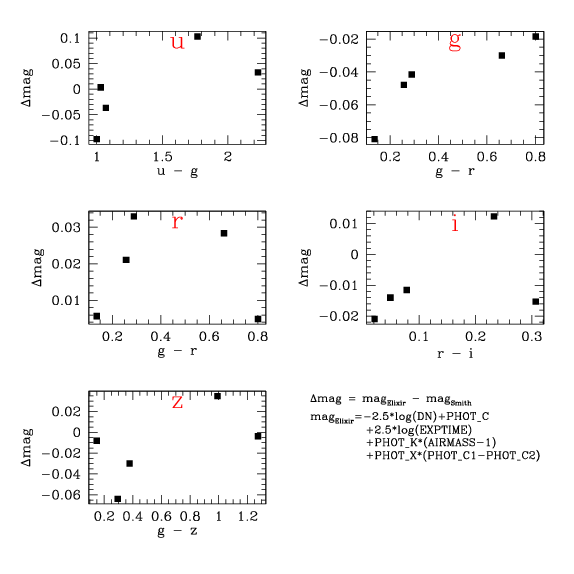
To investigate these offsets, Elixir processed images of standard star fields were examined. The standard stars (from Smith et al. 2002 ) were identified and photometry computed for them through 1.5 arcsecond radius apertures. All the corrections relevant corrections were applied:
  • Exposure time
  • Nightly photometric zero-point
  • Extinction
  • Colour term
The Elixir photometry keywords in each image header provided the relevant parameters

The figure at right shows the results. In all cases, the the MegaCam photometry agrees closely with the Smith et al. photometry.


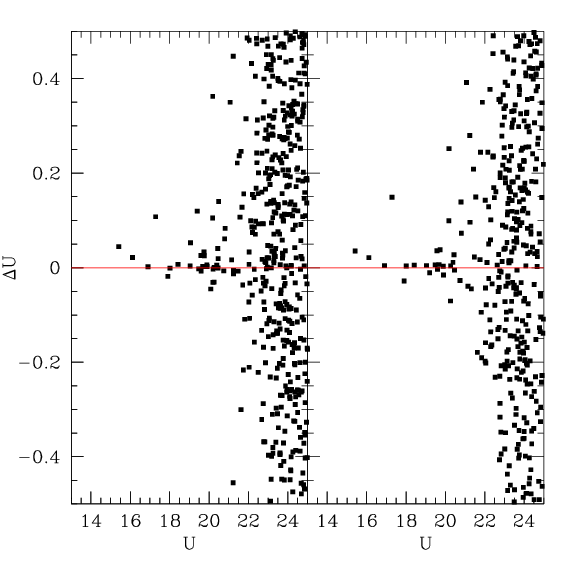
The next step is to check whether the zero-points for each individual Elixir-calibrated image were successfully transferred to the final SWarped image. To check this, one cross references all the objects in the final image to the objects in the individual images and compares their magnitudes. There should be no systematic offset between the photometry in the original images and the stacked images, although there will be more scatter in the shallower, individual images. Obviously, the images not taken under photometric conditions are discarded from this analysis.

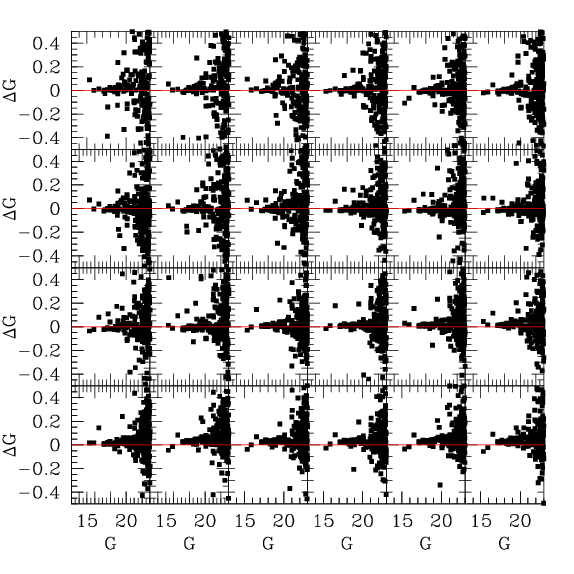
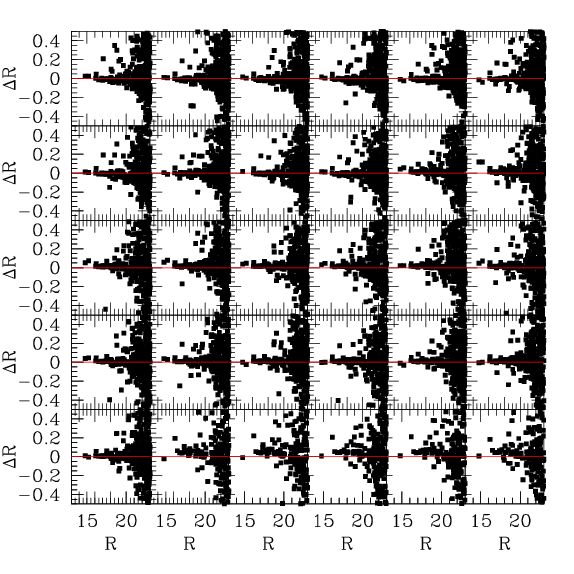
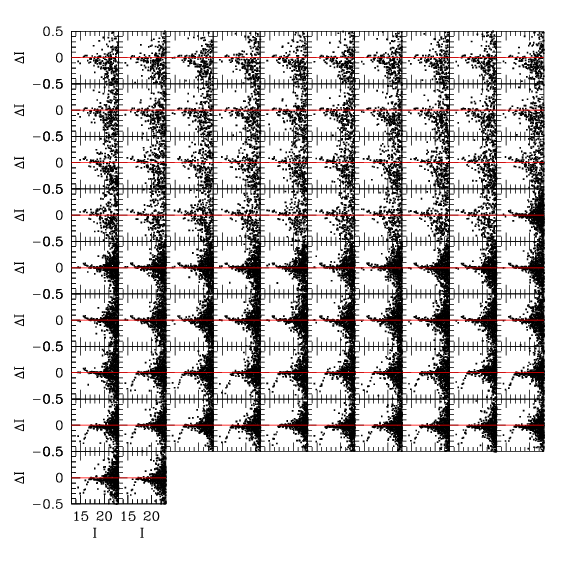
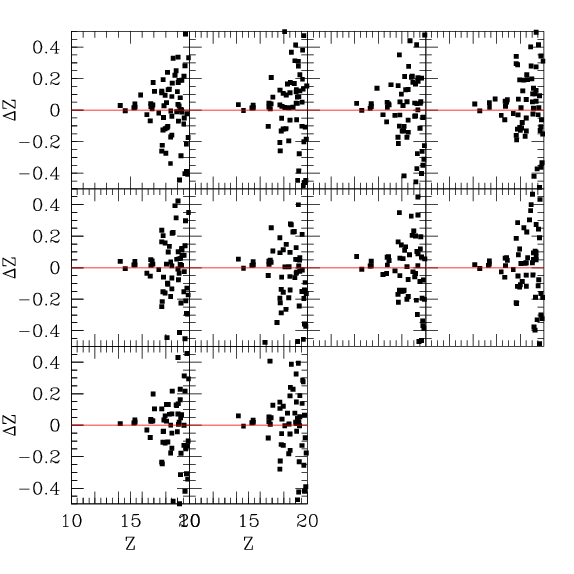
The 5 figures at right show the results of this. Each plot in the figures shows the difference in magnitude between one of the individual images and the final image for that band. There is scatter at faint magnitudes and some individual images are slightly offset, but overall, the stacked and individual images appear to be well matched photometrically. Although there are small shifts for some images.


Back to Stephen Gwyn's CFHTLS pages
Send comments/suggestions/problems to

gwyn@uvastro.phys.uvic.ca