Stephen Gwyn's
Web Pages
HomeCFHTLS Pages
MMM Pages
VIRMOS Pages
Academic Page
Photometric Redshift Page
Hubble Deep Field North
Hubble Deep Field South
Personal Page
Photometric Redshifts |
What are photometric redshifts?
Photometric redshifts (also known as "colour redshifts") use broad band photometry to measure the redshifts of galaxies rather than spectroscopy.
In general, the redshift of a galaxy is measured spectroscopically. The spectrum of the galaxy is observed and recorded. Lines, generally emission lines, are identified and their wavelengths measured. The measured wavelengths are compared with the rest wavelengths to determine the redshift. With photometric redshifts broad band photometry is compared to predictions from galaxy spectral energy distributions (SED's) to determine the redshift. Rather than observing narrow spectral features of galaxy spectra, such as lines, the photometric redshift technique concentrates on broad features, such as the 4000Å break and the overall shape of a spectrum.
Why use photometric redshifts?
Speed.
Photometric redshifts can be measured much faster than their spectroscopic counterparts. In spectroscopy, the light from the galaxy is separated into narrow wavelength bins a few angstroms across. Each bin then receives only a small fraction of the total light from the galaxy. Hence, to achieve a sufficiently high signal-to-noise ratio in each bin, long integration times are required. For photometry, however, the bins are much larger, typically 1000 Å wide. It requires only a short exposure time to reach the same signal-to-noise ratio. Further, imaging detectors usually cover a greater area of the sky than multi-object spectrographs. This means that the redshifts of more objects can be measured simultaneously by using photometry than by spectroscopy.
Why not use photometric redshifts?
The uncertainties of photometric redshifts are larger than those spectroscopic redshifts.
Redshifts measured spectroscopically have uncertainties on the order of +/- 0.001, while photometric redshift uncertainties are typically +/- 0.1. For studying individual galaxies, this is a less than useful level of uncertainty. For determining properties of large numbers of galaxies, however, this uncertainty is quite tolerable.
What can I do with photometric redshifts?
Lots of things.
- Loh & Spillar (1986, ApJL 307,L1) used them to measure Omega_0
-
Gwyn (1995, M.Sc. Thesis, see below) used them measure the luminosity
function at
=0.3. - SubbaRao et al. (1996 [astro-ph/9606075]) used them measure the luminosity function to B=24.
- Liu et al. (1998) used them to determine luminosity functions out to U=21.
- Steidel et al. (among others, 1996 [astro-ph/9602024]) used them to preselect interesting (that is high redshift) galaxies for spectroscopy.
- Gwyn & Hartwick (1996, [astro-ph/9603149]) and numerous others) used them to measure the redshift distribution and luminosity function in the Hubble Deep Field (HDF). More of this later.
- Hudson, Gwyn, Dahle & Kaiser (1998) used them to make a rough measurement of the bulk lensing in the HDF.
- Giallongo et al., (1998, AJ, 115, 2169) to detect high (z>4) redshift galaxies.
- Madau et al. (1996, MNRAS, 283 1388), Connolly et al. (1997, ApJ, 486, 11), Pascarelle, Lanzetta, & Fernandez-Soto (1998, ApJL, 508, L1), and Gwyn (2000, in preparation) used them to study the star formation history of the universe by observing the evolution of the ultraviolet luminosity density.
- Kodama, Bower & Bell (1998, [astro-ph/9810138]) used them to study the colour-magnitude relation of early-type galaxies in the Hubble Deep Field. Pello et al. (1996) used them to find a cluster of galaxies at z=0.75.
What is the template fitting technique?
The technique can be divided into three steps:
The photometric data for each galaxy are converted into spectral energy distributions (SED's). The magnitude in each bandpass is converted to a flux (power per unit bandwidth per unit aperture area) at the central or effective wavelength, of the bandpass. When the flux is plotted against wavelength for each of the bandpasses, a low resolution spectral energy distribution is created.
A set of template spectra of all Hubble types and redshifts ranging from z=0 to z=(maximum relevant redshift, eg z=5 for the HDF) is compiled. The redshifted spectra were reduced to the passband averaged fluxes at the central wavelengths of the passbands, in order to compare the template spectra with the SED's of the observed galaxies.
The spectral energy distribution derived from the observed magnitudes of each object is compared to each template spectrum in turn. The best matching spectrum, and hence the redshift, is determined by minimizing chi^2.
Where can I learn about virtually every photometric redshift technique used in the past?
Has this page been copied over to the NASA Extragalactic Database?
Where can learn more about photometric redshifts in general and the template fitting technique in particular?
My Master's Thesis (262 K) explains this in greater detail.
Where can I get information about the photometric redshifts for the Hubble Deep Field as described by Stephen D. J. Gwyn and F. D. A. Hartwick in " The Redshift Distribution and Luminosity Functions of Galaxies in the Hubble Deep Field": 1996, ApJ Letters 468,L77?
The photometric redshifts for galaxies in the HDFN can be found here.
The photometric redshifts for galaxies in the HDFS can be found here.
Several improvements have been made since the paper.
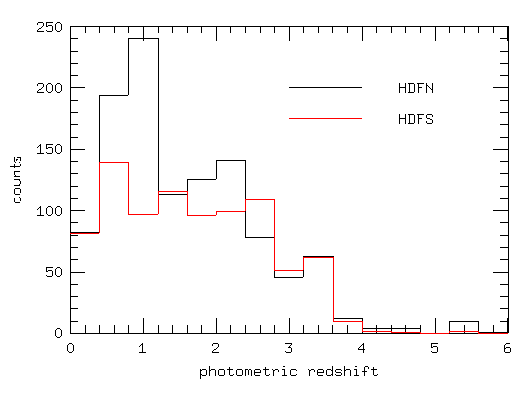
First, the galaxy sample has been selected through a larger aperture. The sample in paper was defined to be all galaxies brighter than I_ST=28 as measured through a 0.2 arcsecond radius aperture. This aperture was used because it provides accurate colours. It does not, however give very accurate total magnitudes. The sample is now defined to be brighter than I_ST=28 as measured through a 1.5 arcsecond radius aperture. (The photometry used to determine the redshifts is now measured through 0.5 arcsecond radius apertures.) Not surprisingly, there are substantially more galaxies in this new sample. The redshift distribution changes slightly as well. The distribution of the Hubble Deep Field South is shown has a dashed line.

Second, the intergalactic absorption corrections of Madau (1995, ApJ 441,18) have been applied to the templates. This didn't change the redshifts much but did reduce the scatter somewhat, particularly at the high redshift end.
Third, the templates have been changed. The (otherwise admirable) templates of Coleman, Wu & Weedman (1980, ApJSup, 43, 393) do not extend far enough in to the ultra-violet to be used to determine the redshifts beyond z=1.5. They have been extended using the theoretical models of the PEGASE group. Extensions using other models (e.g. the Bruzual & Charlot (1993, ApJ, 405, 538)) ot by extrapolation (in the manner of Ferguson & McGaugh to 912Å (1994,[astro-ph/9409071]) were considered but were found to produce significantly larger residuals.
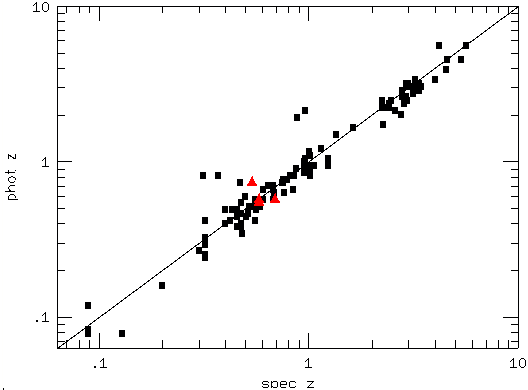
Fourth, about 50 new spectroscopic redshifts have been published. They have been compared to the corresponding spectroscopic redshifts. The redshift residuals are shown in the following figure. Note the logarthmic scale

Send comments/suggestions/problems to gwyn@uvastro.phys.uvic.ca