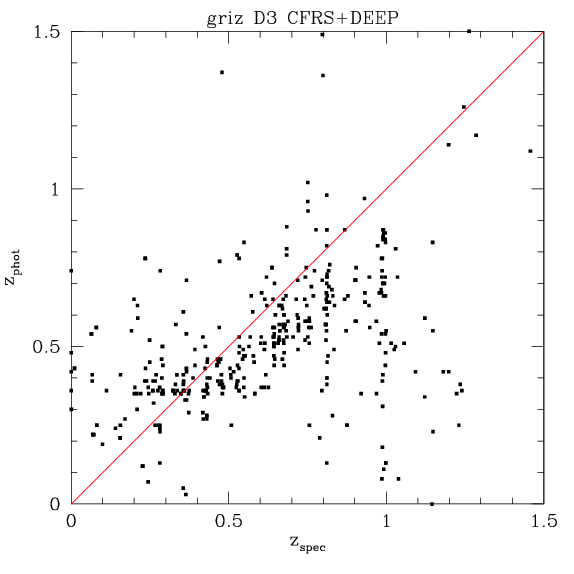
The figure at the right shows the comparison of the photometric redshifts with the available spectroscopic redshifts in the D3 field. The photometric redshifts are less than satisfactory, with substantial scatter and a large offset.

|
Summary:
The first attempt to measure photometric redshift in the CFHTLS D3 field is described. It would appear that the current zeropoint offsets preclude reliable photometric redshifts. |
|
Dave Balam has prepared stacks combining the available
data on the D3 field. Photometry was obtained with SExtractor.
SExtractor's "double image mode" makes it possible to get
photometry with perfectly matched apertures in multiple images.
Kron magnitudes (SExtractor's MAG_AUTO) were used.
The catalogs from the different bands and different chips
were combined into one master photometric catalog.
Spectroscopic redshifts from the CFRS and DEEP were retrieved from the web. The assembled redshifts can be found here. This list was cross referenced with the photometric catalog. Photometric redshifts were measured with gwynz which works with the template fitting method. The filter curves used are described here; the spectra templates are described here The results are shown below. |
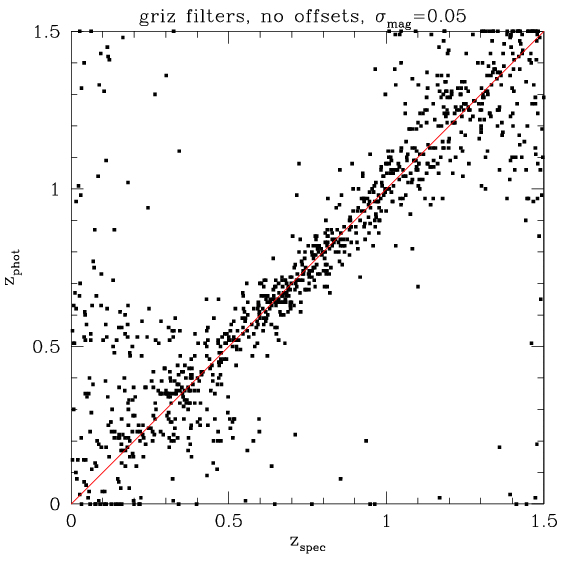
 The figure at the right shows the results of similar simulations, only this time without the u-band filter. Below z=0.6 and above the z=1.2 there is more scatter than in the simulation that includes all 5 ugriz filters. Having ultra-violet information is important at low redshifts in order to bracket the 4000 Angstrom break. Similar results are noted in Figure 7.1 of Gwyn (1995) and Gwyn (1996, unpublished) which compare the relative usefulness of the UBVRI and BVRI filter sets. |
 |
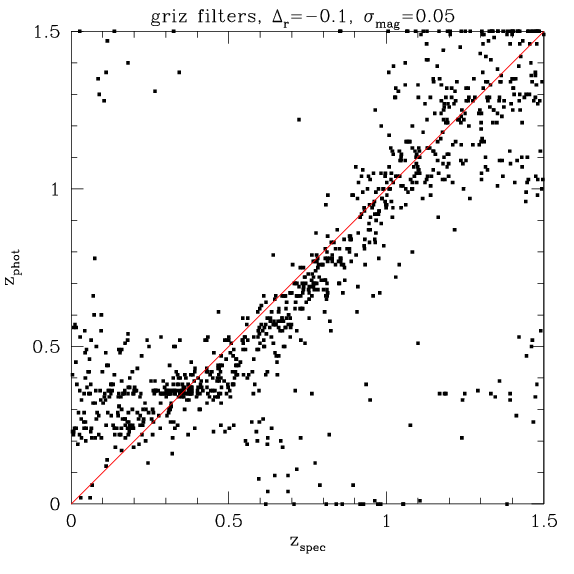
 The situation gets worse if there is a small zero-point offset in the photometry of the nature noted here. The figure at the right shows the results of another simulation, this time with a 0.1 magnitude shift in the r-band zero-point. As can be seen in the figure, the bulk of the phot-z's are shifted towards lower redshifts with respect to the spectroscopic redshifts. A number of similar simulations have been run; they all indicate that even small (0.1 to 0.2 magnitude) shifts in the photometric zero-points cause fairly drastic shifts in the photometric redshifts. The problem is compounded if there are shifts in more than one band. |
 |
|
Conclusion:
The first attempt to measure photometric redshift in the CFHTLS D3 field is not very satisfactory. Simulations point to the lack of the u-band data and zero-point uncertainties as the cause. However, the simulations also indicate that CFHTLS has the potential to produce quite accurate photometric redshifts, once these problems are solved. |
Back to Stephen Gwyn's CFHTLS pages
Send comments/suggestions/problems to