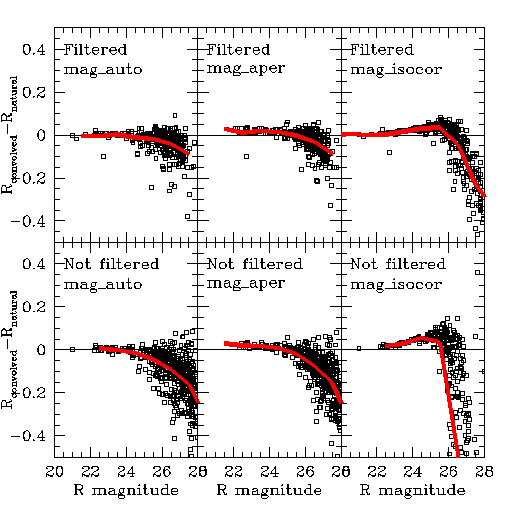
| The question is, what is the effects of degrading the PSF on the photometry. The answer appears to be: "Not much" |
| Because the seeing is significantly different in some bands relative
to others, it might be necessary to degrade the high resolution images
until down to the seeing of the low resolution images. The question then
arises "What happens" to the photometry.
In the 1024x1024 test image section, the R band image has 0.7" seeing, while the I band image has 0.9" seeing. The psfmatch task in IRAF was used to change the R PSF to the I PSF. SExtractor was then used to get photometry. To avoid matching problems, the same image was used as a detection image. The results are shown in graph below. The diffence between the magnitudes in "convolved" (articifal degraded seeing) image and the "natural" (original undegraded seeing) image are plotted against the "convolved magnitudes. The dots show individual galaxies. The heavy red line is the average. Various SExtractor photometry methods are shown: MAG_AUTO --> Kron magnitudes,
"Filtered" means "FILTER Y" in SExtractor
|
| This graph uses the "natural" image as the detection image |  |
| This graph uses the "convolved" image as the detection image | 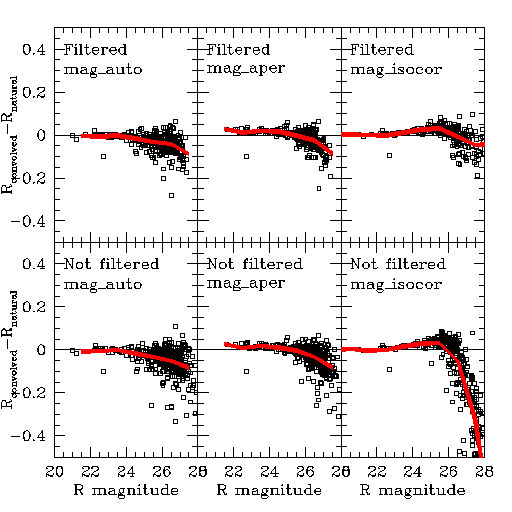 |
| Clearly convolution does affect the photometry. The aperture magnitudes lose light for bright objects (not surprisingly). At the faint end, convolution seems to put light into the apertures. However the effect is slight until beyond the detection limit of R=25.5. (see below the graphs below) Note that setting FILTER=Y in SExtractor seems to help. |
Conclusions:
|
Appendix 1: limiting R band magnitudesThe following graphs are plots of surface brightness in the R band vs. total R magnitude. The black dots show detected galaxies. The red numbers give the completeness levels (in percent) at different values of magnitude and surface brightness as determined from the simulations. The blue lines are contours at the 90%, 70% and 50% completeness limits. These contours bound the detected galaxies on both the the total magnitude and peak surface brightness edges. The join between these two bounds takes a variety of shapes, but is generally not a right angle. The green dots show the false-positive detections. The magenta line shows the locus of point-sources in the I - µI plane. In the graphs to the far right (scroll in your browser) the points have the same meaning but the blue numbers indicate the percentage fraction of false-positve detections, in the sense of false/true. |
| This figure shows the R band magnitude limits using the chi-squared image for detection, with filtering. The symbols and colours have the same meaning as in previous web pages. | 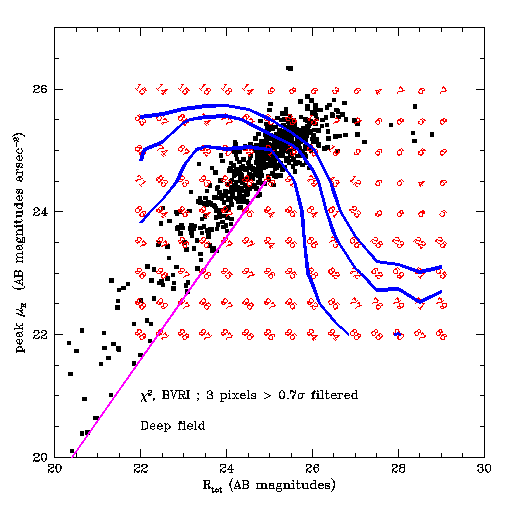 |
| This figure shows the R band magnitude limits using the chi-squared image for detection, without filtering. | 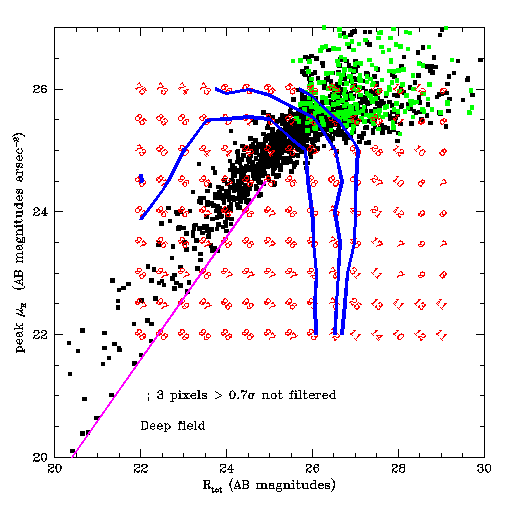 |
Appendix 1: using IRAF
|
| The same as the first graphs except the last two panels show the results of using IRAF instead of SExtractor. | 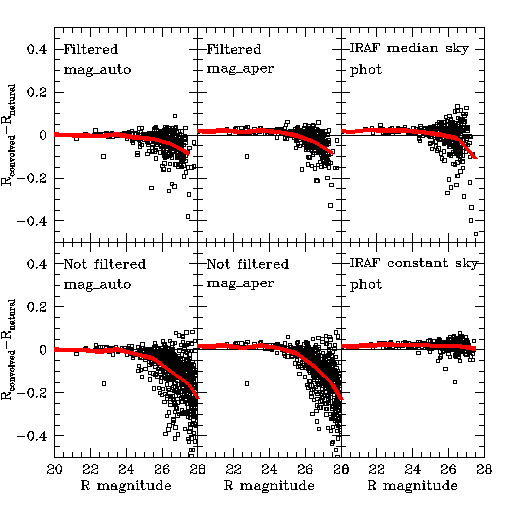 |
| Clearly IRAF isn't affected to the same degree as SExtractor. However, since the difference is only significant below the detection limit, the effect can be ignored. |