Magnitude and Surface Brightness Limits (Version 3)

The idea here is to test various galaxy detection methods to see which produce the deepest, most reliable galaxy catalogs by adding artifical galaxies to a subection of the VIRMOS images and attempting to
retreive them using various detection criteria.

Both depth and reliability are important. In the extreme example, if uses as detection criteria: "an object must have greater than the sky background flux in one or more pixels" (an extremely liberal example) one will have an extremely deep catalog, but not a reliable one. If however one only uses: "galaxies which are detected in all four bands at the 20-sigma level", one will have a very reliable catalog, but one will not detect any Lyman break galaxies.

There are two tests: one is to test the rate at which galaxies are missed; the second is to test the rate at which noise peaks are mistaken for genuine objects.

To test the completeness limits of various detection schemes I have written a program which adds several artifical galaxies to a 1024x1024 pixel sub-section of the VIRMOS images. One can then run SExtractor to see which galaxies are detected. By varying the surface brightness and magnitudes one can determine completeness as a function of these
parameters.

The image subsection was provided by Henry McCracken. It is a portion of the 2 hr field. I have further reduced the image in size (to speed the iterations) to 1024x1024 subsection. The entire subsection is imaged to the same depth; that is to say,  the weighting is uniform. This is obviously a much simplified version of what will be a much more complicated problem.

The Fortran program (addgal4.f) adds galaxies to all four images. Initially,  the added galaxies were modeled with an face-on exponential profile. (See version 1 of this page.) However since only a few galaxies will have such profiles, more realistic galaxies are now added. Further, since the effects of seeing are important, one must convolve the exponential profile with a Gaussian. This will alter the surface brightness, making it hard to generate galaxies with the correct surface brightness.
Although one could add galaxies with exponential disks, tilted, appropriately convolved with the seeing, mixed with some deVaucouleurs profiles, the easier and probably more realistic approach is to use the galaxies in the field itself. The other advantage of this method is that the colours of the galaxies will automatically be typical of the field. (Although there will some small effects; colour is probably correlated with magnitude.)

A set of 100 bright, isolated galaxies was selected out of the field and ssembled into a master list. Postage stamps of these galaxies were cut out of the field. In order to test the magnitude limits, the galaxies are made fainter. This done by dividing the postage stamp by some number to scale it down to a fainter total magnitude. Testing the surface brightness limits is trickier. To make a galaxy fainter while keeping its total magnitude constant, one must spread the galaxy out, extending its wings. This was done by resampling the original galaxy images at sub-pixel resolution, interpolating as necessary, using bi-linear interpolation. In this way it possible to take a bright galaxy and fade it out to any surface brightness and total magnitude.

Each time addgal4 is run, it adds 40 galaxies. Adding more generally results in artifically low completeness especially at bright magnitudes, as the galaxies start to overlap with each other and with the real galaxies. As it is, the maximum possible completeness is about 98-99%. All the galaxies are of the same brightness (I and µI). 

The galaxies are selected at random from all the galaxies on the master list. Only galaxies brighter than the desired magnitude/surface brightness combination are used: brightening a faint galaxy is obviously undesirable. Each galaxy is then faded and smeared to the desired magnitude/surface brightness combination and added to the image. The program then writes the image and the location of the added galaxies to disk. Galaxies are added to all 4 of the BVRI images, although currently, only the I band is used for detection. The figure to the right illustrates this procedure.

One can then run SExtractor to retrieve the artifical galaxies, with whichever detection criteria are desired. This process can be repeated several times for a range of magnitudes and surface brightnesses. The process needs to be run about 10 times at for (I, mu_I) pair. Currently, this process is controlled with PERL script: compchi.pl
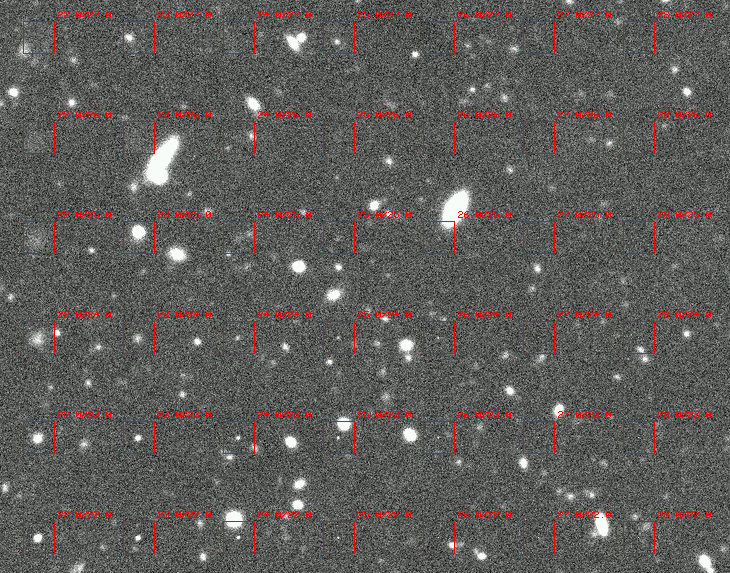
An illustration of adding galaxies: The same galaxy has been added multiple times to the image. The galaxy has faded to various magnitudes and surface brightnesses. The boxes contain the galaxy. The boxes are labeled by mag/surface brightness. Note the galaxy at I/µI =23/25 accidentally ended up near a bright galaxy and is only partially visible. The I band is shown here. Normally of course, the galaxies are not placed in such a regular grid.
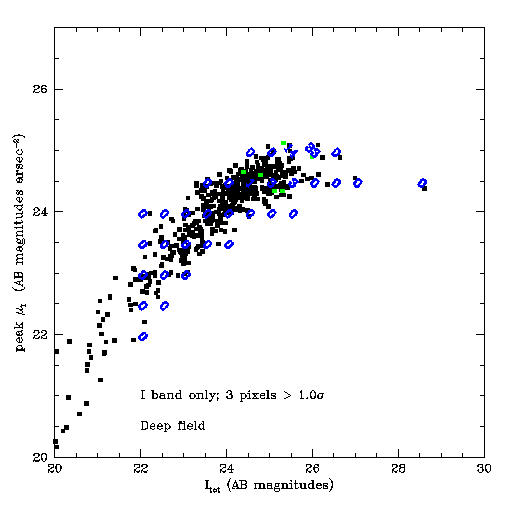
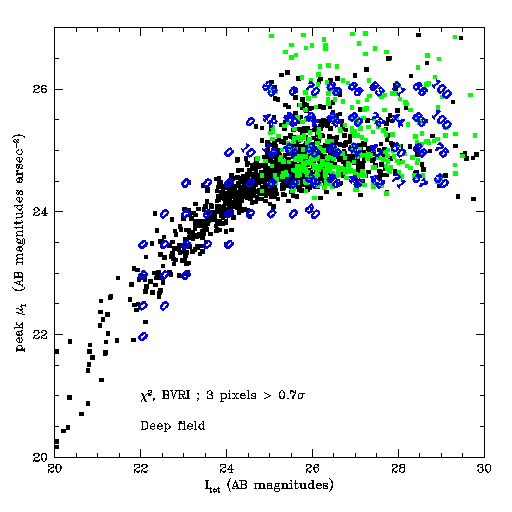
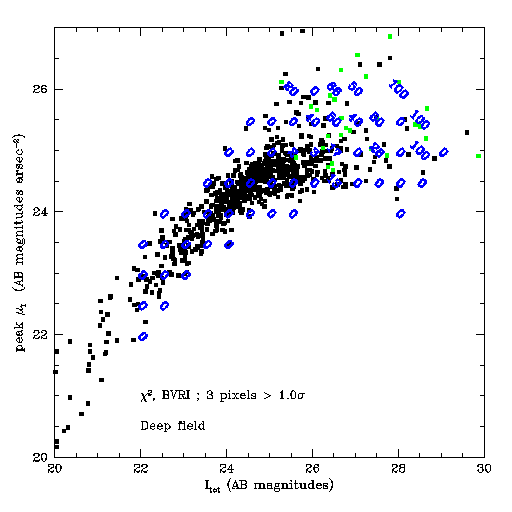
To test the false-positive rate, The original image was multiplyed by -1; the noise peaks became noise troughs and vice-versa. SExtractor was run, using the same detection criteria. Since there are no real negative galaxies, all the objects thus detected are spurious. The galaxies are plotted up in the magnitude/surface brightness plane.
So far, two detection prodcedures have been examined. The first is to use the I band image by itself. The second is to combine the BVRI images into a chi-squared detection image. Briefly, image is first scaled so that a value of 1 in a pixel corresponds to 1 sigma of the background. Next, each image is squared. The four images are added together. The square root of this summed image (divided by the square root of the number of images) is then a chi-squared image. 
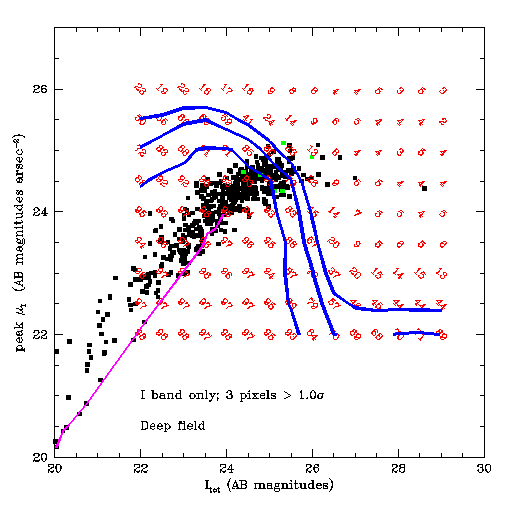
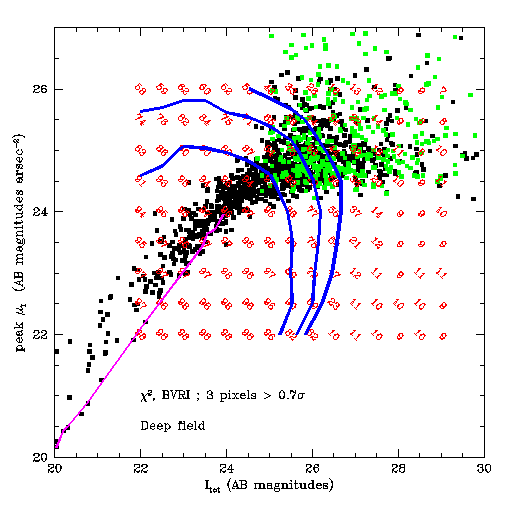
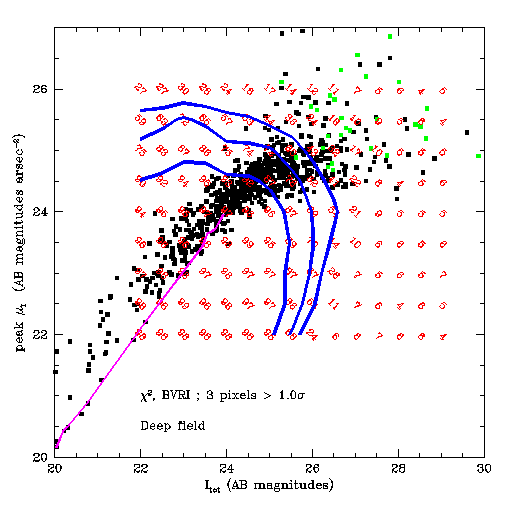
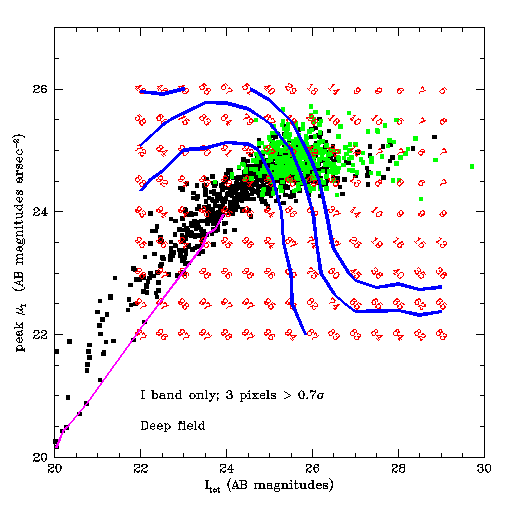
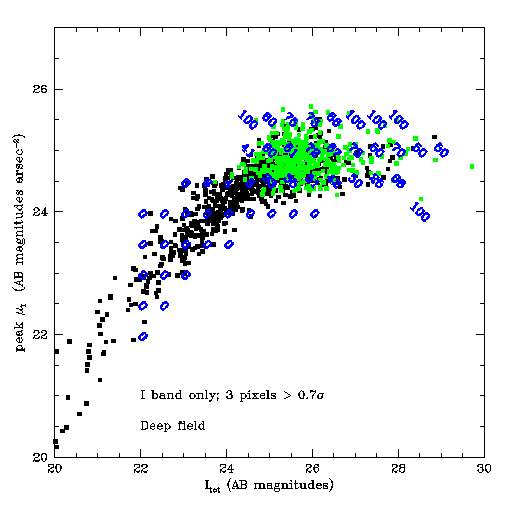
The following graphs are plots of surface brightness in the I band vs. total I magnitude. The black dots show detected galaxies. The red numbers give the completeness levels (in percent) at different values of magnitude and surface brightness as determined from the simulations. The blue lines are contours at the 90%, 70% and 50% completeness limits. These contours bound the detected galaxies on both the the total magnitude and peak surface brightness edges. The join between these two bounds takes a variety of shapes, but is generally not a right angle. The green dots show the false-positive detections. The magenta line shows the locus of point-sources in the  I - µI plane. The line was made by identify a few stars in the image and plotting their magnitudes and surface brightnesses. The I - µ values for these stars are simply connected (join-the-dots). This locus seems fairly well defined.In the graphs to the far right (scroll in your browser) the points have the same meaning but the blue numbers indicate the percentage fraction of false-positve detections, in the sense of false/true.
The detection criteria for the graph to the right are: 3 contiguous pixels in the I band image must be greater than 0.7 times the RMS of the background. Note the large number of false detections.
The detection criteria for the graph to the right are: 3 contiguous pixels in the I band image must be greater than 1.0 times the RMS of the background. Not surprisingly, considerably fewer galaxies are detected. However, very few false galaxies were detected in the negative image.
The detection criteria for the graph to the right are: 3 contiguous pixels in the chi-squared image must be greater than 0.7. The 90% completeness limit is quite faint but it there are a large number of false detections.

Compare this figure to the previous one. Note the numerous objects at faint surface brightnesses but still fairly bright magnitudes that are missed in the I-only detection scheme.

The detection criteria for the graph to the right are: 3 contiguous pixels in the chi-squared image must be greater than 1.0. There are considerably fewer false detections.
The thing that all these graphs have in common is that the locus of the detected galaxies cuts the 90% completeness contours on the surface brightness edge, not the total magnitude edge, although sometimes the cut is near the join between the two edges. However, in all the figures, at 24.5 magnitudes, the sample is complete to around 90%.
Conclusions:
  • The chi-squared detection method finds several low surface brightness galaxies that are missed by the I-only detection method.
  • Pushing the detection limit below 1-sigma really only increases the false-positive rate.
  • All the detection methods yield a sample that is surface brightness limited, rather than a magnitude limited sample.
  • However, at the spectroscopic limit of 24.5, the sample is at least 90% complete.s