Zero-point difference between CCD's: Part 2

Summary:
  • There is a zero point shift between CCD's
  • It is not due to measurement errors
  • It might be due to flatfielding errors
As discussed here there is appears to be a 0.1 magnitude shift between the zero-points of sum of the CFH12K data in the VIRMOS survey. This shift appears to be throughout the data. This webpages examines some of the possible causes:
  • Measurement error
  • Flatfielding error

Measurement error:

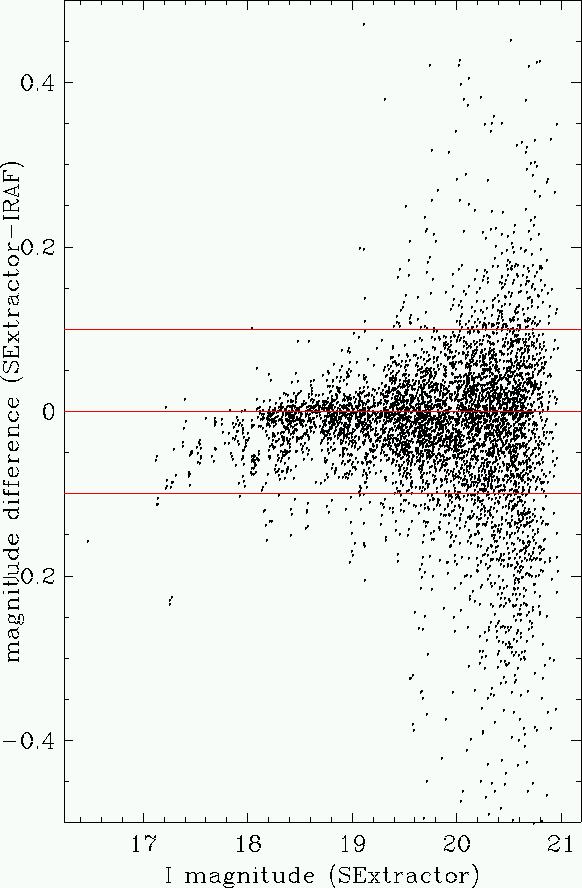
This was examined by comparing the raw (uncorrected for extinction, zeropoint or exposure time) magntiudes generated by SExtractor with those measured by IRAF. The SExtractor centers were passed to the IRAF packages, phot. The same aperture was used. As can be seen on the following plot, there is no significant difference.
SExtractor vs. IRAF
The plot to the right shows the difference between the raw magnitudes calculated by SExtractor and IRAF. The x-axis is the SExtractor magntiude corrected for exposure time, zero-point, and extinction. The average difference is -0.015 magnitudes with a standard deviation of 0.053 magntiudes. The differences are presumably due to the diffrence in the way SExtractor measures the sky background (setting up a background map for the whole image) and the way IRAF measures the sky background (taking the mode of the sky in an annulus around each object). The red lines show the 0 and +/-0.1 magnitude offsets. The dots shown correspond to all 4 CCD's involved a particular offset.

Flatfielding error:

In the detrending procedure for the images is as follows:
  • Subtract the overscan value
  • Subtract the bias
  • Subtract the dark current
  • Divide by the flat field
  • Optionally, subtract the superflat (to remove fringes)
At the end of the procedure, every pixel of every image should effectively have the same quantum effiency and gain. That is to say a value of 1 ADU should correspond to the same number of photons in all the images.

This was examined in a number of ways.
Sky levels:
Since the sky is of uniform brightness, all the pixels of all the CCDs of one exposure should have the same value.

First the sky level of each CCD of each exposure was compared to the sky level of the other CCDs of the same exposure. The median of was the image was computed. In every case, the average was the same to within 1 percent, (with the exception of some exposures from May 1999) as would be expected. A rather dull table can be found here: backex.txt.

The flatfielding was also checked by examining the variation in the background level across each CCD. SExtractor can be made to produce a background image (CHECKIMAGE=MINIBACKGROUND). These images were examined do determine the maximum variation, as well as the variation from top to bottom, left to right and corner to corner. A not very enlightening table can be found here: backvar.txt. The first column is the name of the image (with a "mb" suffix"). The second column is the average background. The third column is the largest variation (in percent) in the background ("peak to peak") . The next four columns are the variations (again in percent) left to right (fess: -), top to bottom (pale: |), corner-to-corner (bend sinister: /) and corner-to-corner (bend dexter: \) Images are flagged as 'bad' if the peak-to-peak variation exceeds 5% or any of the other measurements exceed 1%. In all cases, the 'bad' measurements are explained by the presence of nearby bright stars.
Gain:
Since the flat fielding procedure used by FLIPS takes into account the differences in instrumental performance (amplifier gain and quantum effiency) from CCD to CCD, the measured gain in the flatfielded images (electrons per ADU) divided by the average quantum effiency of each detectors (detected electrons per incident photon) should be the same for all the CCDs.

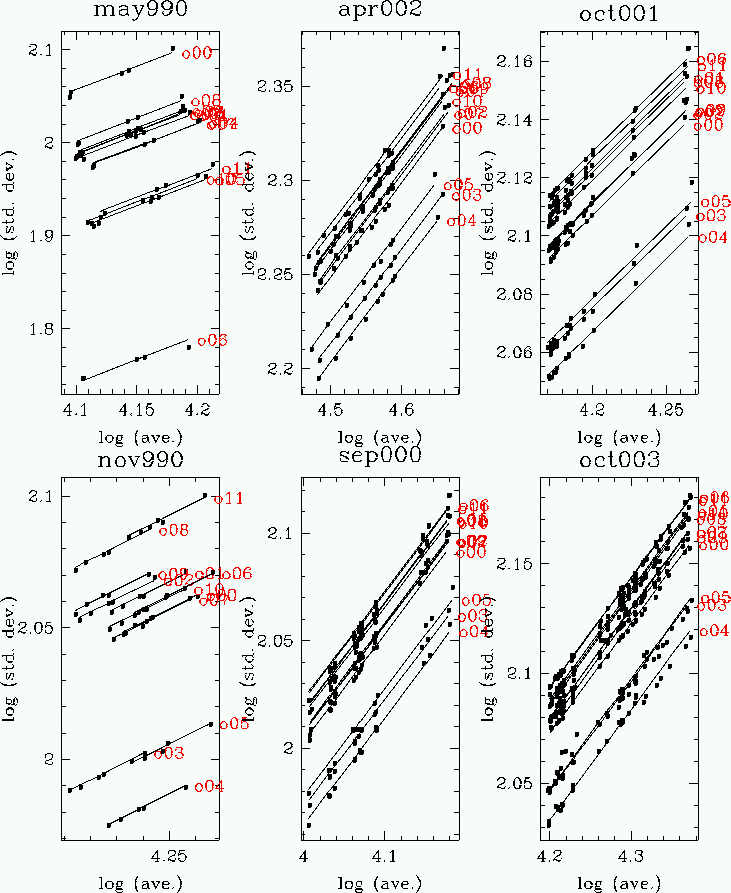
The gain of any image can be determined by examining the statistics of the non-object (ie blank sky) pixels. The standard deviation of the sky (or Noise, N) in electrons is related to the average (or signal, S) in electrons by:
N(e-) = sqrt ( R2 + S(e-) )
Where R is the read noise (in electrons) and g is the gain (in units of e-/ADU). Gain is the conversion factor between e- and ADU. Converting to ADU the above equation in ADU becomes:
N(ADU) = sqrt ( R2 + S(ADU)*g ) /g
Note that the gain does not factor out of this relation. This means that if one plots N(ADU) vs S(ADU), it is possible to determine the gain and the read noise. At low signal, read noise dominates, and can be simply read off the graph. At high signal, the read noise can be neglected and the gain be determined by fitting. The slope of the relation is still one 0.5 on a log-log plot, but with an offset due the gain. The above equation becomes:
N(ADU) = sqrt (S(ADU))  / sqrt(g)
or taking the log:
log  N(ADU) =  0.5 log S (ADU) - 0.5  log g
From this, gain can directly calculated by:
g= S(ADU) / N^2(ADU)

Practically speaking, the values of N were computed by diving each image into 10x10 subrasters and computing the standard deviation for each subraster. By using subrasters, one avoids the problem of including the variations due to fringe pattern. The residual fringe is typically 1%. On an image with a typical flux of 20000 electrons, this causes variations of about 200 e-, while the real noise is about sqrt(20000) = 140 e-. However since the fringes typically vary on scales of about 50 pixels, using 10x10 pixel subrasters effectively acts as high-pass filter, removing the "DC" signal, while retaining the "AC" signal. Subrasters were discarded if any of the 100 pixels was on a bad column (as determined from the relevant mask image) or an object (as determined by using a SExtractor "-OBJECT" check image). The average standard deviation of all the usable subrasters gives the standard deviation for the image.
The values of "N" were computed by taking the median of the image.
All this assumes that there is no residual noise in the flat field.
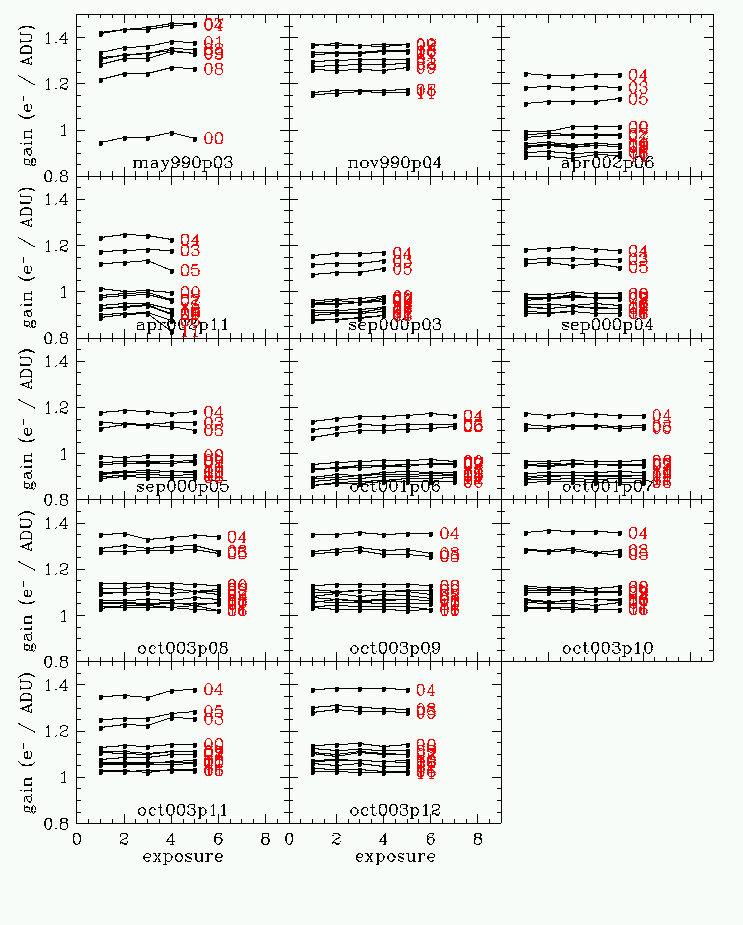
The results are shown in the following figures:
Signal-to-noise of the sky:
Split by epoch, as labelled. The red number indicate CCD's. The lines show fits with a slope of 1/2.
Gain:
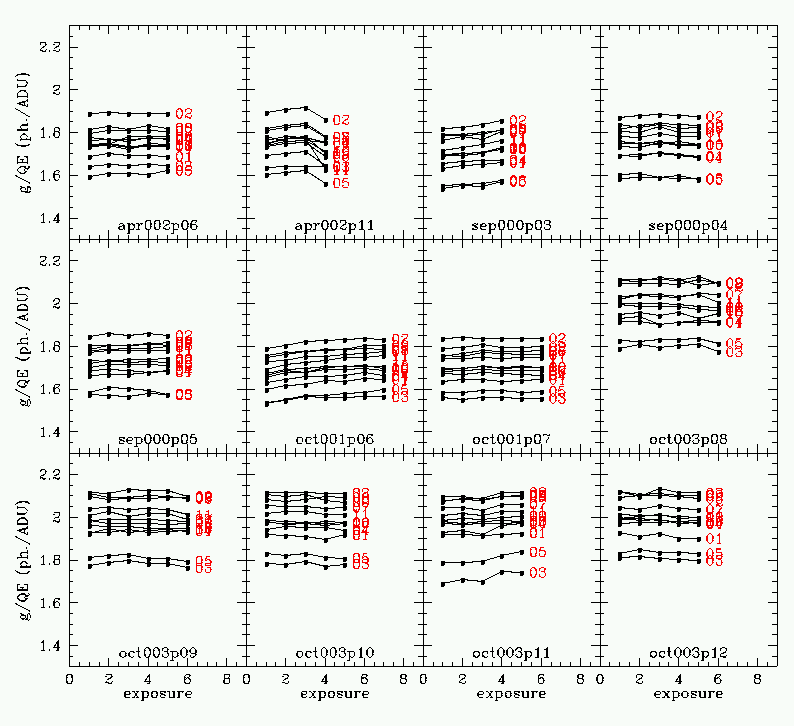
Split epoch by epoch and pointing by pointing as labelled. "Number" is the ordinal of the exposure on the F22I field, and does not correspond the real exposure number". The results are roughly what you would expect based on CFH12K CCD attributes. CCD03, CCD04 and CCD05 have higher quantum effiencies
Quantum Efficiency
From the webpage of J-C Cuillandre http://www.cfht.hawaii.edu/Instruments/Imaging/CFH12K/Summary/CFH12K-FocalPlane.html
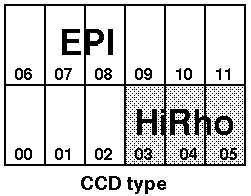
The following image shows the location of the three HiRho CCD's in the CFH12K mosaic.
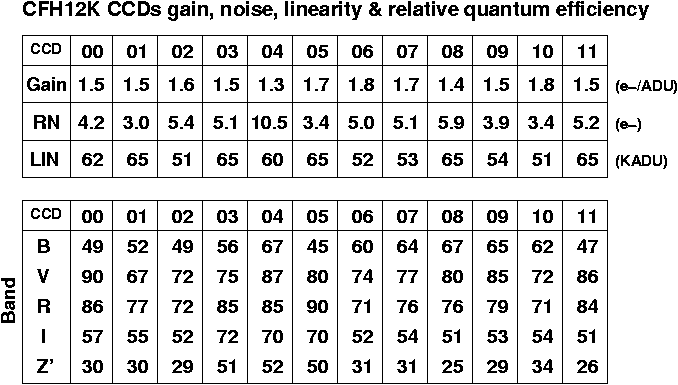
The following table shows various properties of the CCD's. Of interest to the current discussion is the quantum effieciency in I.
Gain divided by quantum effiency
In theory, the flat fielding process should should completely normalize all the CCD's to each other. This is mostly the case, but there are 10% variations. Significantly, CCD03 and CCD05 have seem to have lower values. However, this analysis is subject to a number of uncertainties. Most importantly, the values of the QE in the table may be in error. (Although the QE values are very similar for a given CCD type). Next, the process of measuring the gain is somewhat indirect. It is possible that subtle fringing effects are corrupting the values. Also, any noise in the flat field images will affect the gain measurements.
Standard Stars:
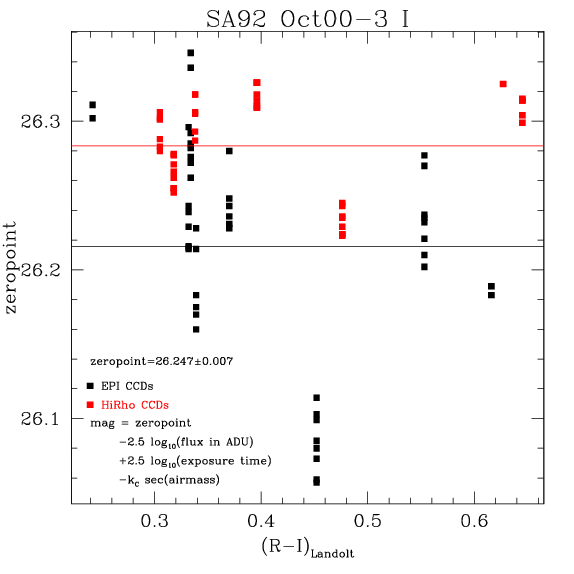
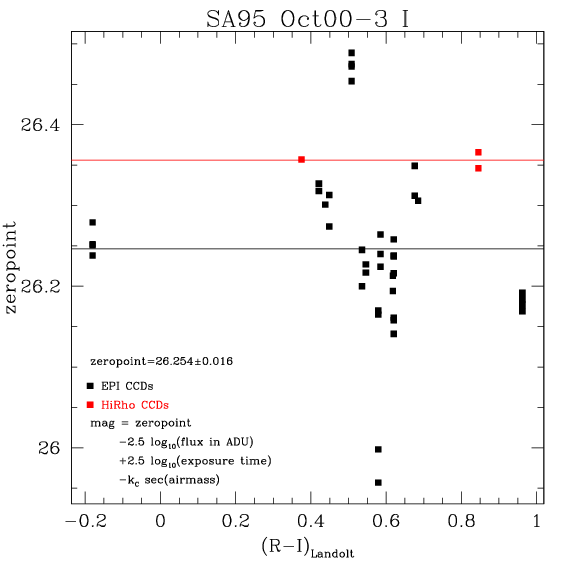
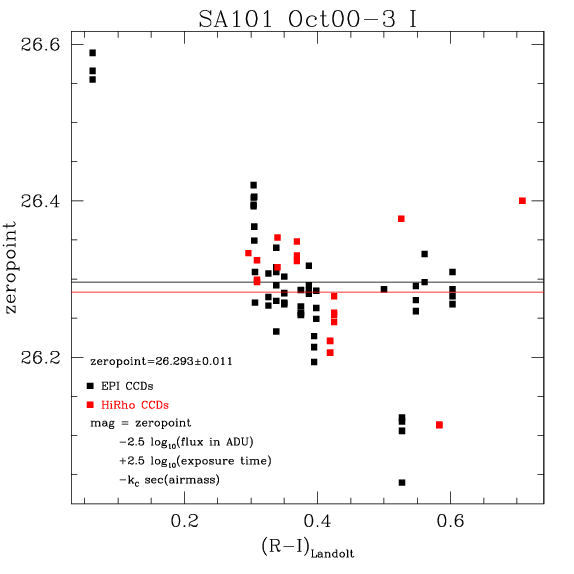
If the 0.1 magnitude shift observed in the data frames is universal and caused by the difference in CCD type, it should also be present in the standard star images. To check this, one calculates two zeropoints, one each for the two types of CCDs. The results show no real shift.
Standard stars The Landolt standards in SA92 October 2000-3, I band. Note the HiRho CCDs appear to have a slightly different average zeropoint thtan the EPI CCDs. The statisical significance of this result is marginal.


Standard stars The Landolt standards in SA95, October 2000-3, I band. Note that the HiRho CCDs also appear to have a slightly different average zeropoint thtan the EPI CCDs. Again, the statisical significance of this result is marginal.


Standard stars The Landolt standards in SA101, October 2000-3, I band. There is no difference between the HiRho and EPI CCD's The weighted average of the three determinations of the zero points si 26.260+/-0.006


Stephen Gwyn
Last modified: Sat Jul 6 15:29:53 MEST 2002