| Summary: There appear to be zero-point differences between the CCD's of the CFH12K data. Within a single exposure, there can be systematic differences in magnitudes of up 0.1 magnitudes between CCD's. |
| I have been reducing the CFH12K data from the 22hr field. I have been assessing the photometric quality of the data by examining the regions where two pointings overlap. Photometric catalogs were generated using SExtractor for each CCD. Zero-points for each exposure were computed using the information on the terapix website (here). The extinction term was computed using the airmass in the header of each image. Objects in each CCD of each exposure were matched by position to the objects in every other CCD of every other exposure that overlapped. For each match, the magnitudes were compared. Naturally, since not all the data were taken under perfectly photometric conditions, there are some shifts between exposures. However, in some cases it appears that there also shifts between different CCD's within a single exposure. This is extremely alarming, because unless the problem can isolated, it is impossible for the final photometry to be more accurate than 0.1 magnitudes all other effects being perfect. |
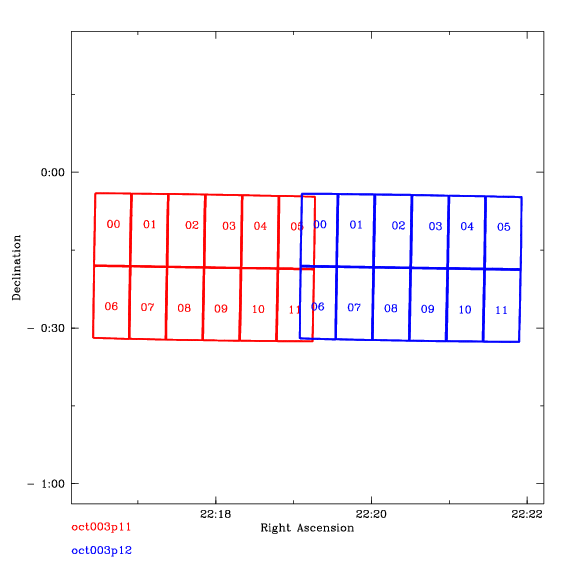
| The figure at right shows two overlapping exposures CCD05 of one exposure overlaps with CCD00 of the other, as do CCD11 and CCD06. |  |
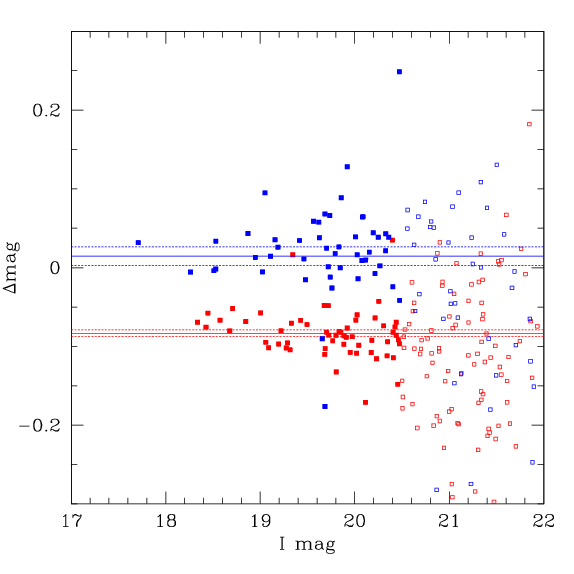
| The figure at right shows a such a shift. The difference
in magnitude between two exposure is plotted against magnitude. The magnitude
difference between two pairs of CCD's is shown. The comparison between
CCD05 of one exposure and CCD00 of the other is shown in blue. The comparison
other pair (CCD11 and CCD06) is shown in red. The solid lines shown the
(sigma-clipped) mean of the differences. The dotted lines show the error
on the mean (standard deviation divided by root N). Only the solid points
are included in the determination of this mean and error.
The two do not agree. While one pair off CCD's show almost no difference in magnitudes, the other pair shows an offset of 0.1 magnitudes. All the distribution of points of the two pairs overlap at the faint end, it is clear that there is a systematic offset. Note that the only difference between the two sets of dots is the CCD pairing. Airmass, exposure time, variations in extinction, cirrus clouds are all identical. It implies that there is a shift in the zero-point of one of the CCD's. Which one, of course, cannot be directly determined. It must be at least one of CCD00, CCD05, CCD06 or CCD11; more than that, one cannot say. |
 |
| The figure at right shows a case where several CCD's of two exposures overlap. The magnitude differences for each pair of CCD's are plotted in a difference colour. Again, although there is overlap, it is clear that some CCD's show significant offset with respect to others. The green dots show a mean that is 0.1 magnitudes away from the black dots. | 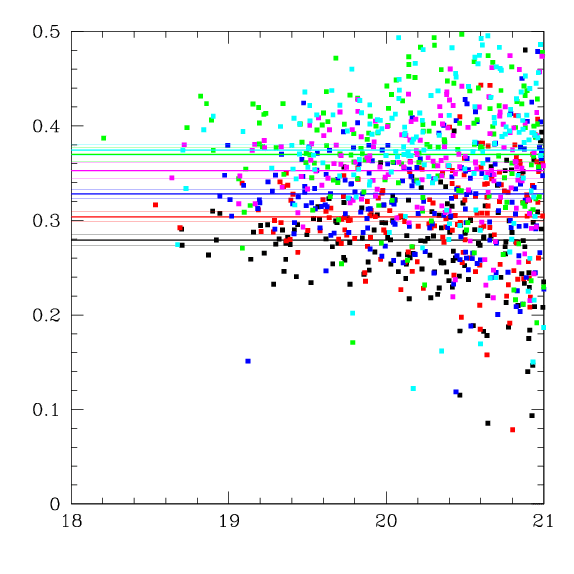 |
| This effect is not confined to a single pair of
exposures. For each pointing, 5 or more exposures were taken. The effect
can be seen in each pair of exposures. This means one can do 25 (5 times
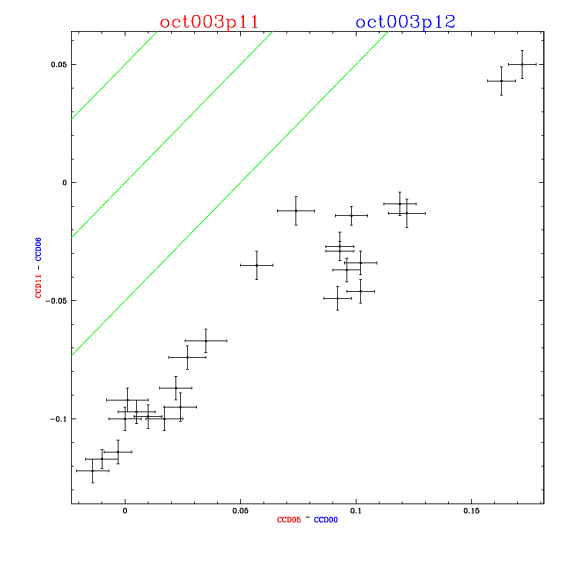
5) or more such comparisons for each pair of pointings. The figure at right
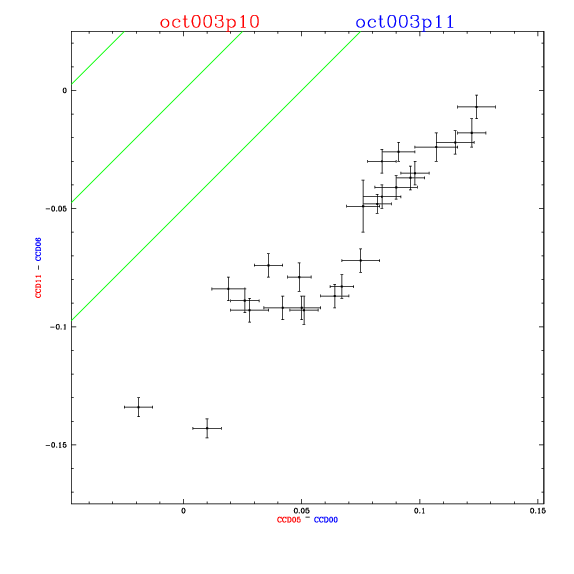
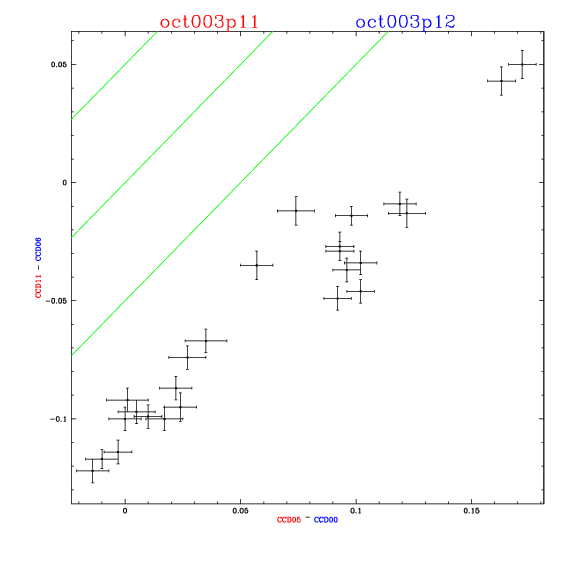
shows these comparisons. On the x-axis the difference between CCD05 and
CCD00 is plotted, while the y-axis shows the difference between CCD11 and
CCD06. Each point represents a pair of exposures. The green lines are represent
offsets of -0.05, 0.00 and +0.05 magnitudes. Normally, all the points should
be on the zero-offset line, or at least between the 0.05 magnitude lines.
The figure shows that for every pair of exposures there is a systematic offset between the zero-points of the CCD's and that this offset appears to be fixed. |
 |
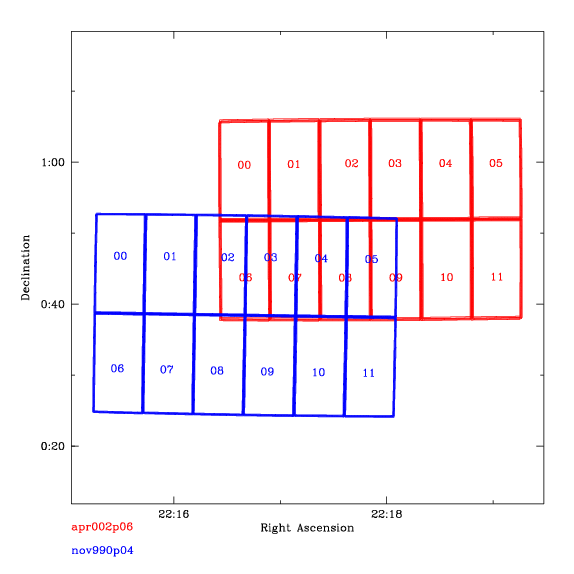
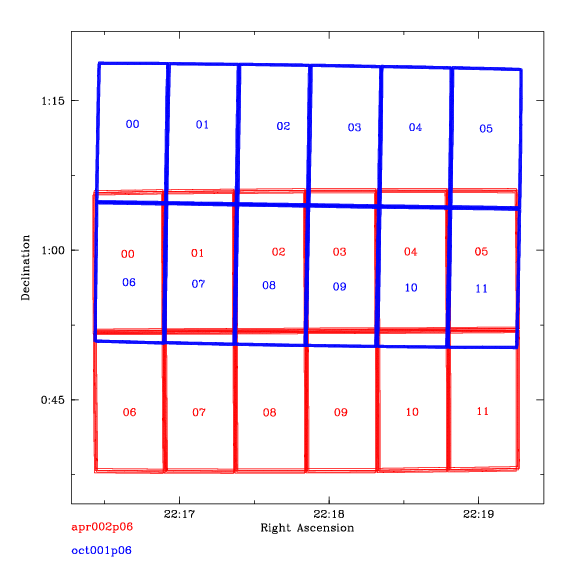
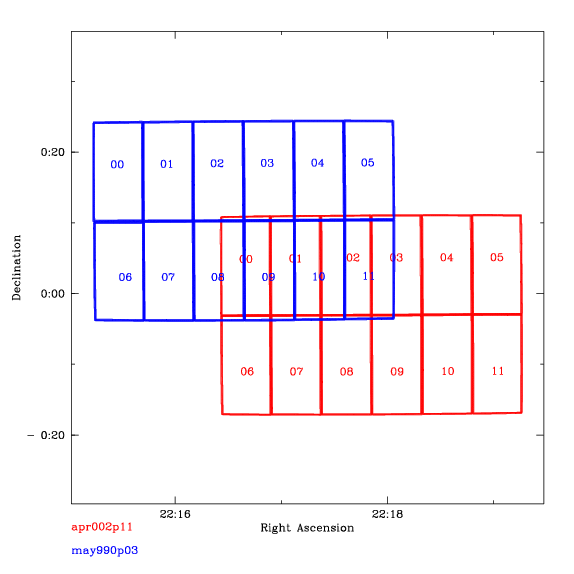
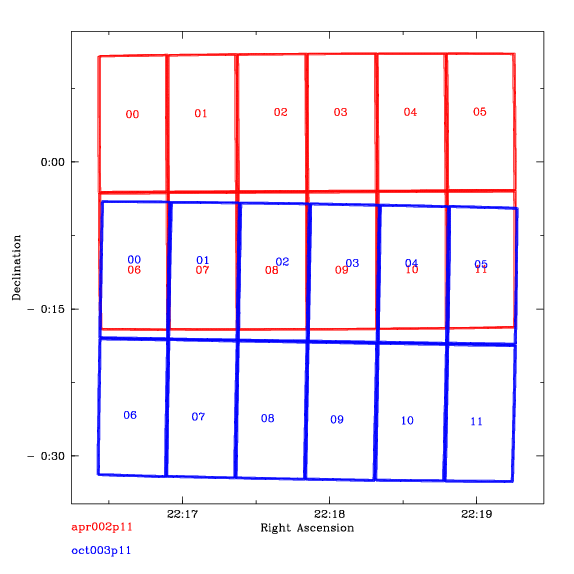
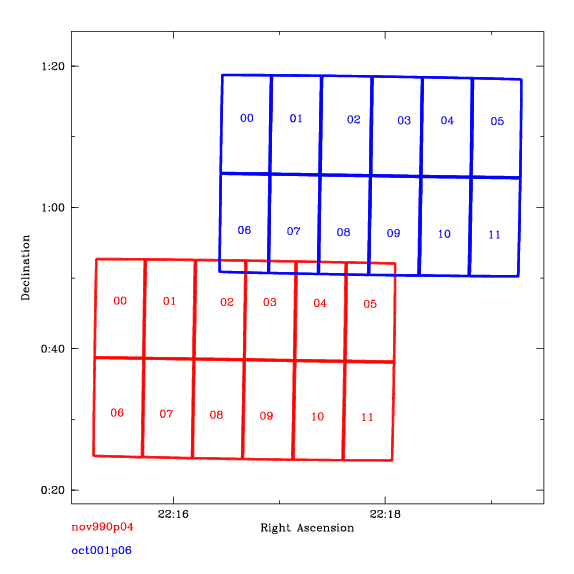
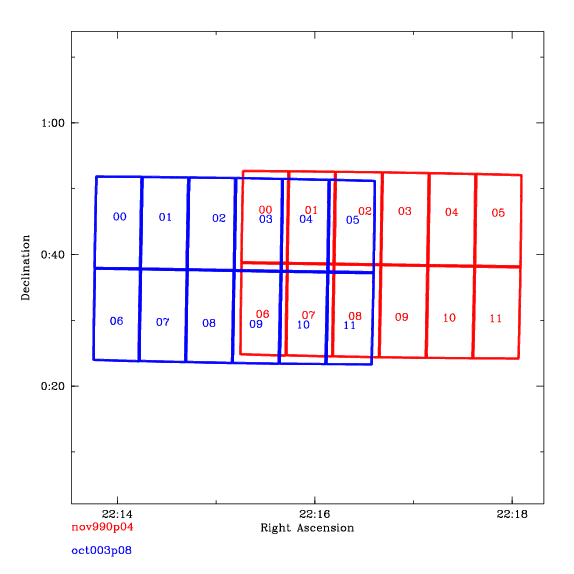
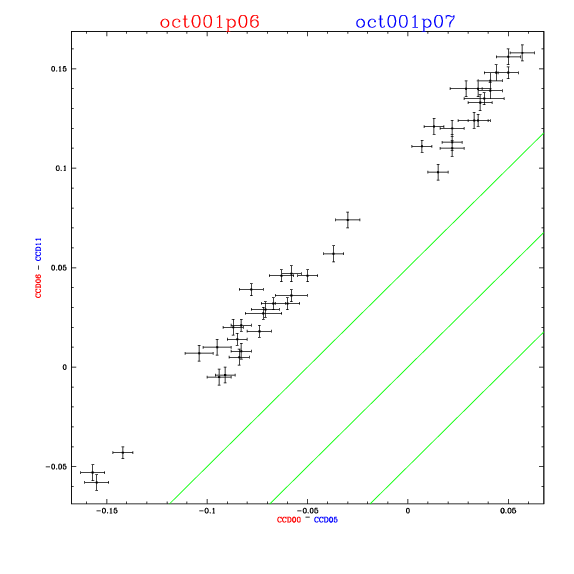
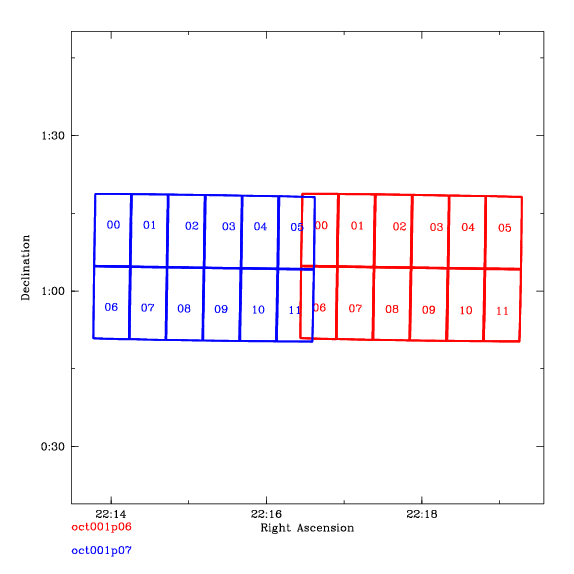
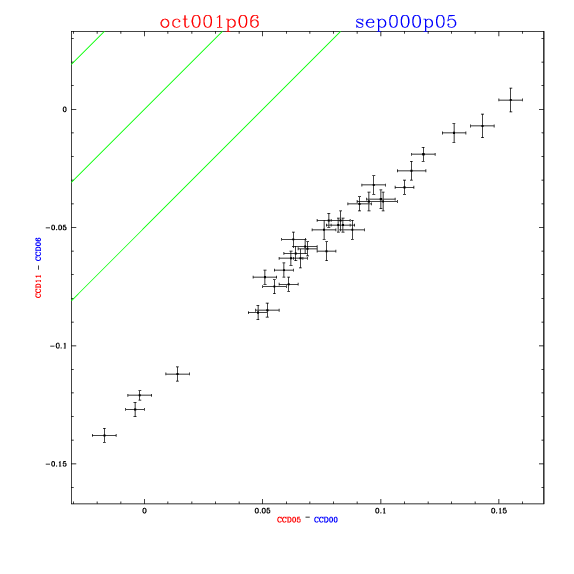
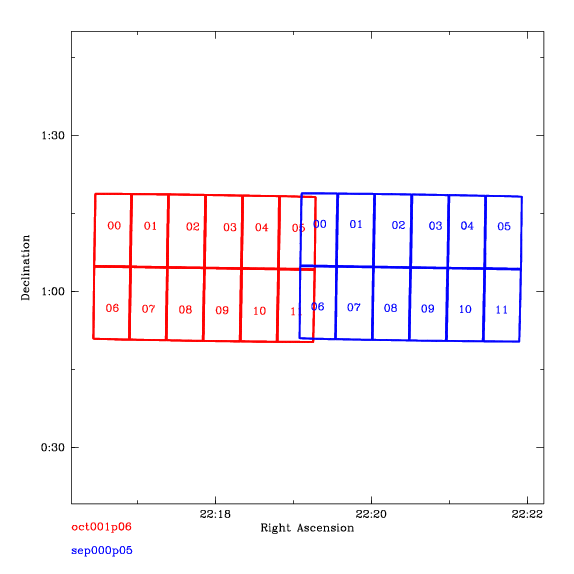
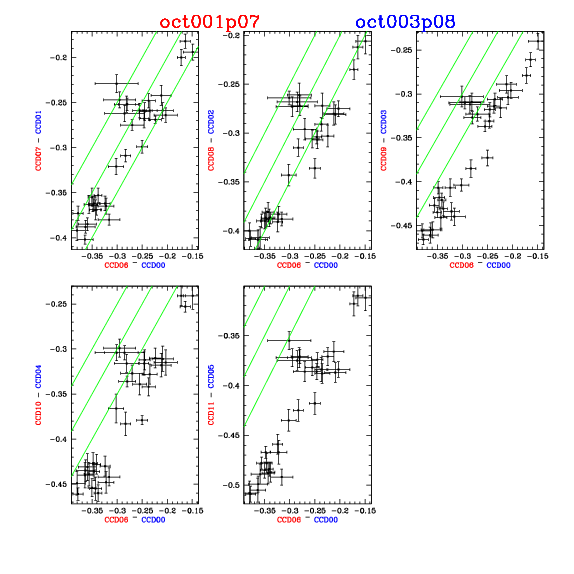
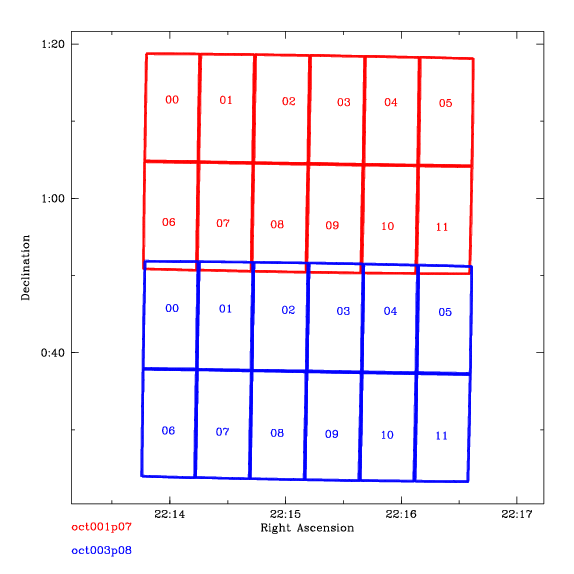
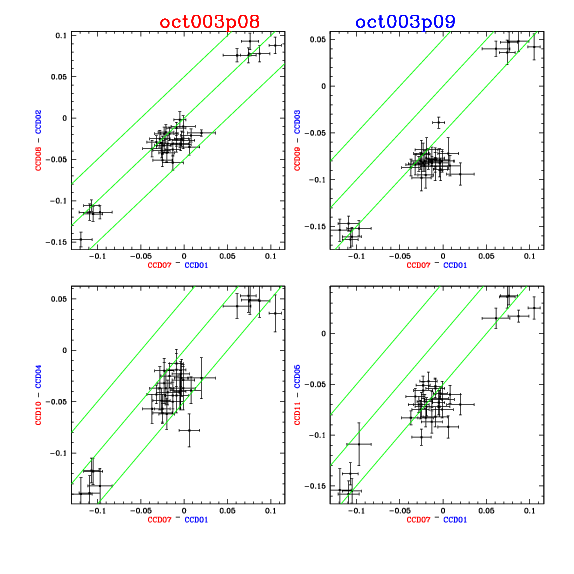
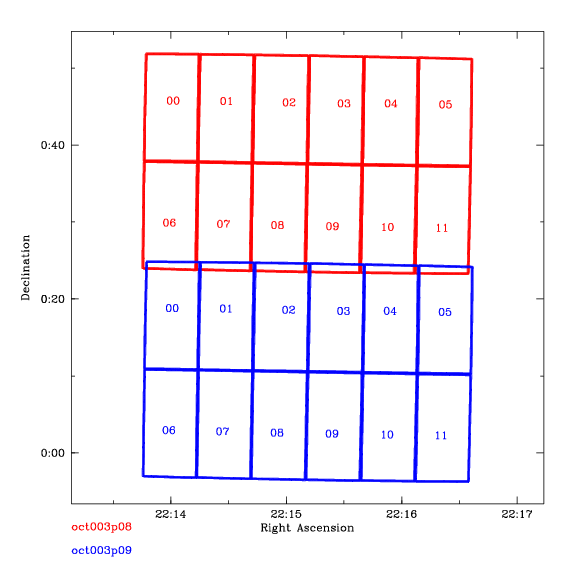
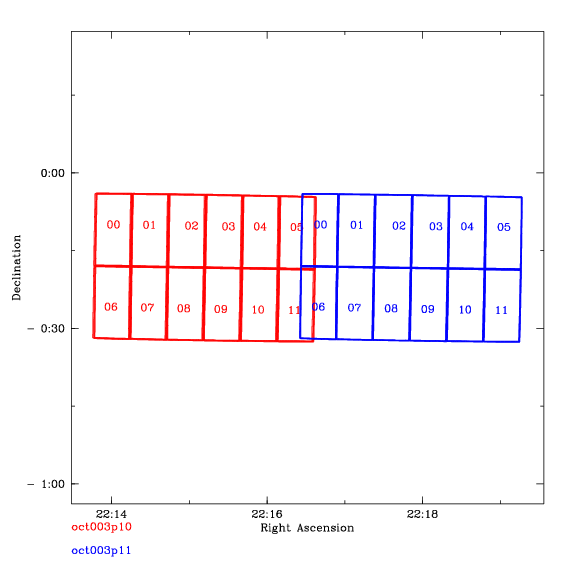
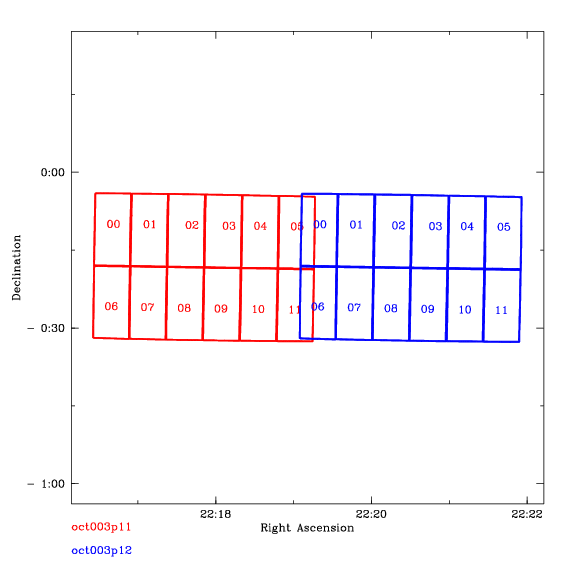
The following table shows multiple examples. The right panel shows
the geometry of the overlaps. Each CCD is labeled. The pointings and epochs
are noted in the appropriate colour at the lower left hand colour. The
notation is as follows:
apr002p06
^  ^ ^^^
|  | |||__ the pointing number
|  | ||___ the letter "p"
|  | |____ sub-epoch (some months have more than 1 run)
|  |______ last two digits of the year (not Y2K compliant)
|_________ month
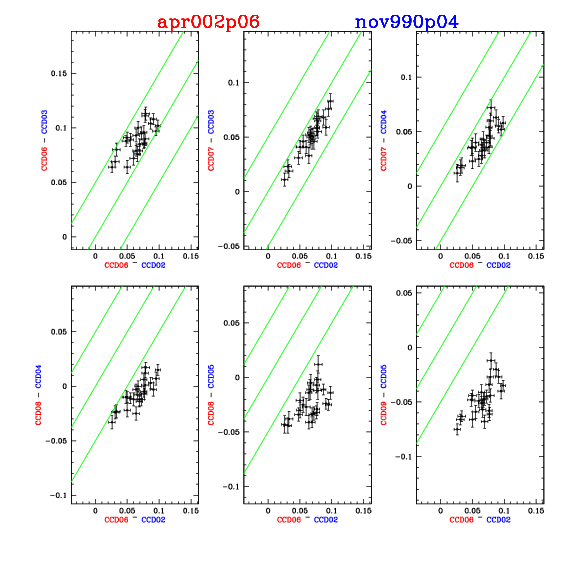
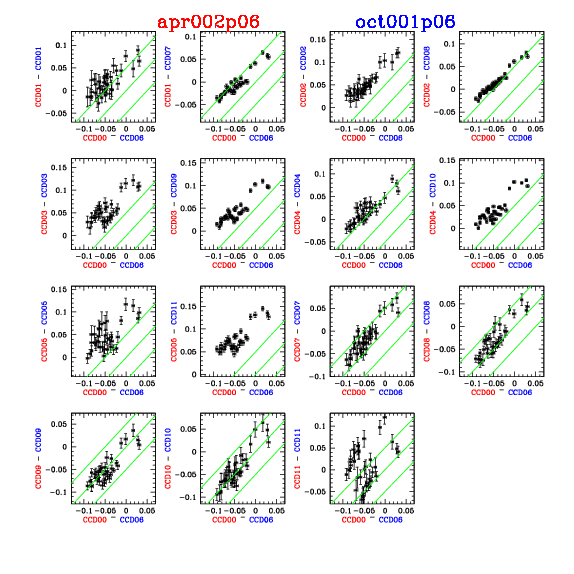
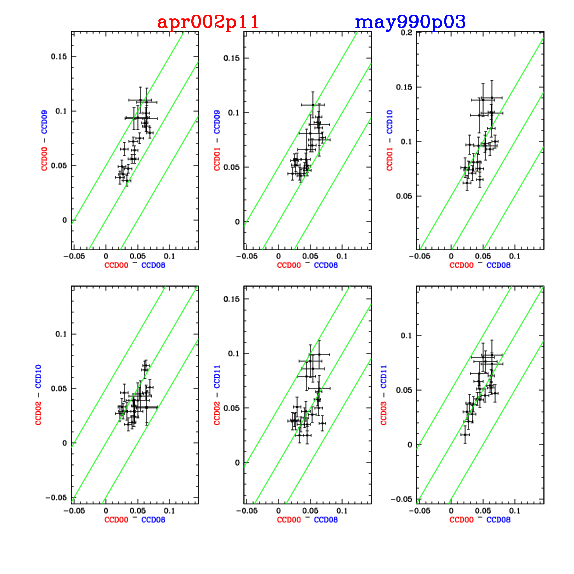
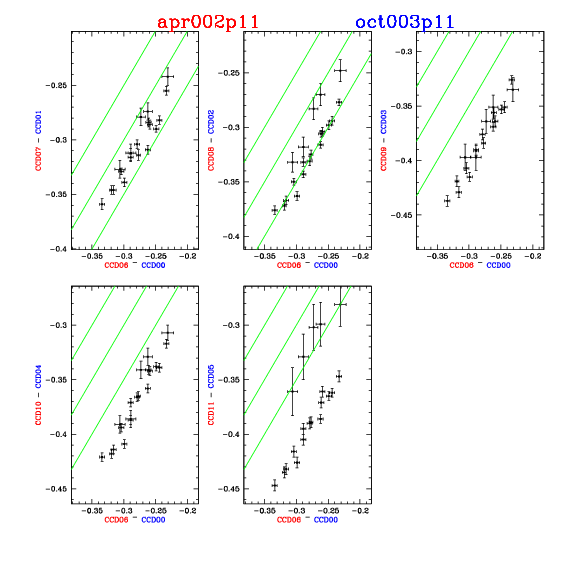
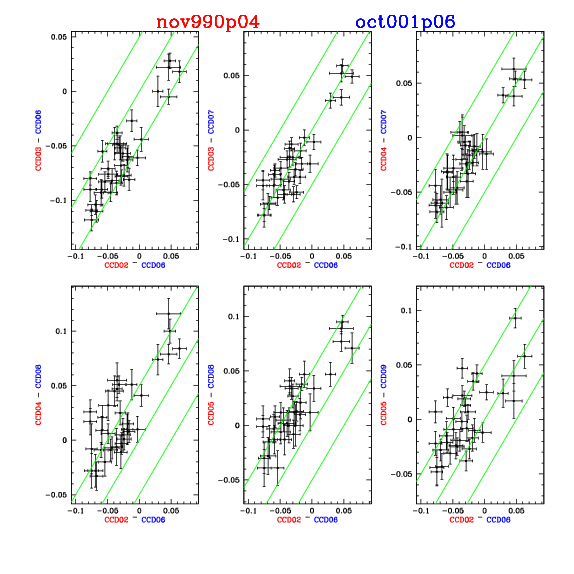
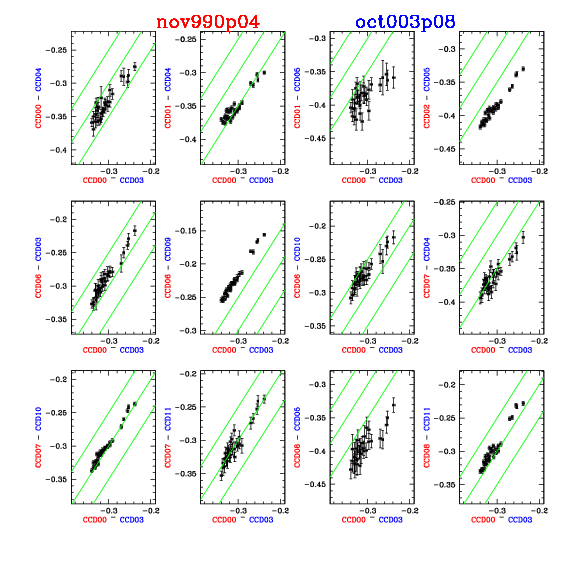
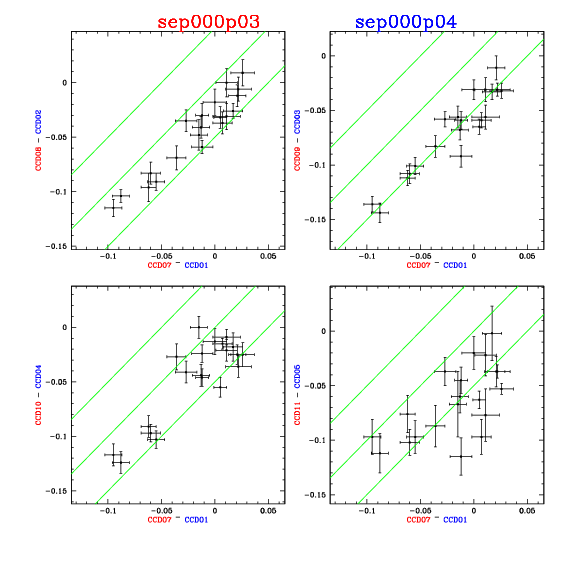
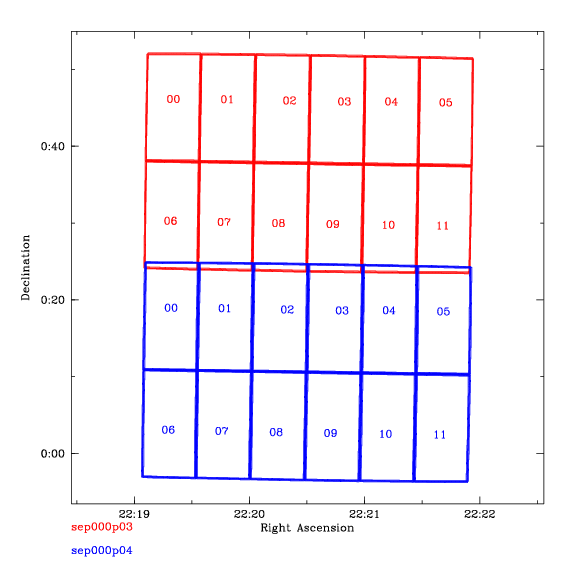
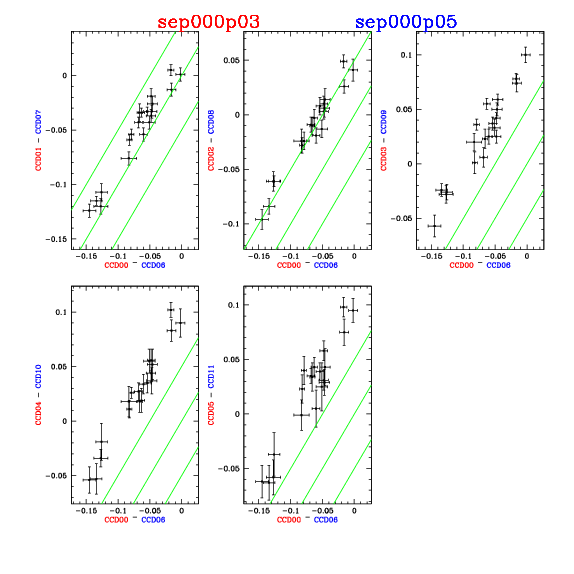
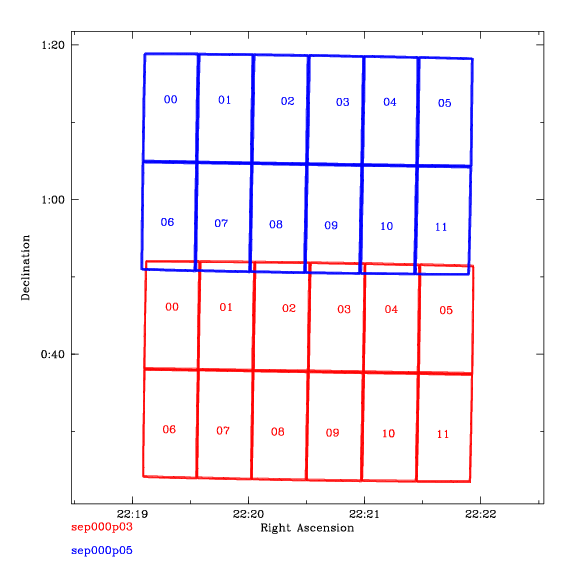
For each line, the left panel shows the comparison between CCD zero-point offsets. In some cases, only there are only two overlapping pairs of CCD's. In other cases, there are multiple overlaps. In these cases, there multiple graphs comparing the different pairs of CCD's. Each of the left-hand panels is labeled with the pointing and the epoch in colours corresponding to the right-hand panels. In these panels, the axes are labeled with the CCD's in question, colour-coded according to the pointing and epoch. For example in the first row of the table, the upper left-hand graph plots the difference in magnitude offsets between CCD06 from April 2000, pointing P6 and CCD02 from November 1999, pointing P4 on the x-axis and the offsets between CCD06 from April 2000, pointing P6 and CCD03 from November 1999, pointing P4 on the x-axis. Over all, the figures show that the zero-point offset is not present in all the CCD's of all the exposures. However, determining which CCD's are affected is rather complicated. Some CCD's of some epoch are affected, but which CCD's of which epochs is not so clear. There is some suggestion that CCD03, CCD04 and CCD05 are affected (these three CCD's are of a different sort than the other nine) but this is not conclusive. |
 |
 |
 |
 |
 |
 |
 |
 |
 |
 |
 |
 |
 |
 |
 |
 |
 |
 |
 |
 |
 |
 |
 |
 |
 |
 |
 |
 |
Conclusions:
F22I.links |