The near right uses BVRIK, the far right only BVRI. There are only minute differences between the two graphs.


The near right uses BVRIK, the far right only BVRI. Again, both graphs are very similar.


| K band data is available for a fraction of the deep field. The effects of using the K data as well as the BVRI data are examined. It is found that adding K has no effect on the detection limits. |
| The completeness of deep I image using the BVRI chi-squared detection image has been tested already. The results can be found here. This pages examines the effects of adding the K to the BVRI chi-squared image. |
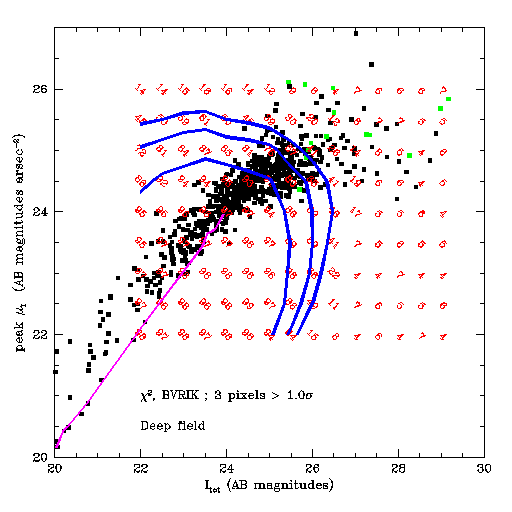
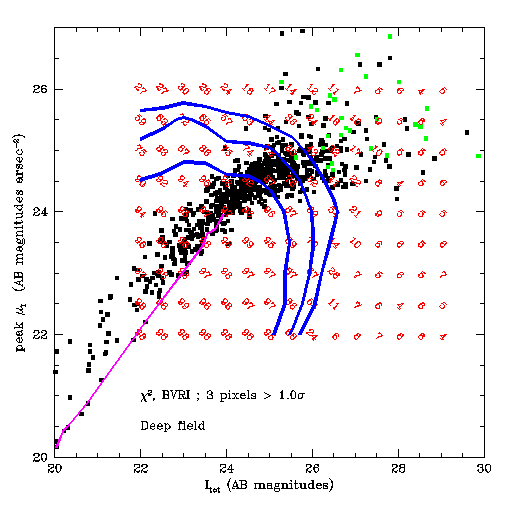
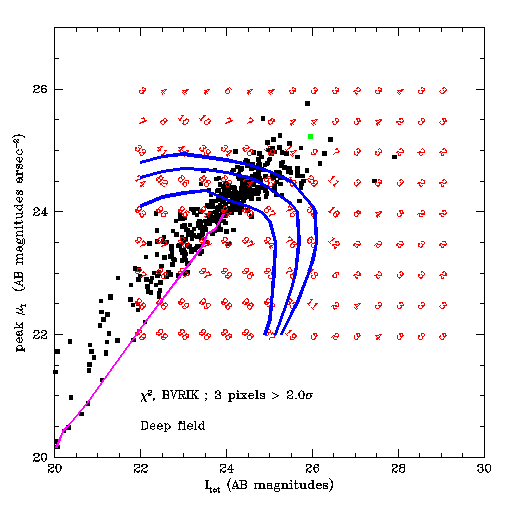
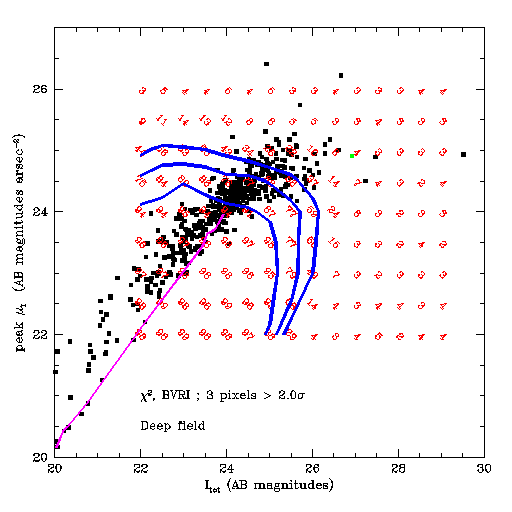
| The following graphs are plots of surface brightness in the I band vs. total I magnitude. The black dots show detected galaxies. The red numbers give the completeness levels (in percent) at different values of magnitude and surface brightness as determined from the simulations. The blue lines are contours at the 90%, 70% and 50% completeness limits. These contours bound the detected galaxies on both the the total magnitude and peak surface brightness edges. The join between these two bounds takes a variety of shapes, but is generally not a right angle. The green dots show the false-positive detections. The magenta line shows the locus of point-sources in the I - µI plane. The line was made by identify a few stars in the image and plotting their magnitudes and surface brightnesses. The I - µI values for these stars are simply connected (join-the-dots). This locus seems fairly well defined |
| The detection criteria for the graphs to the right
are: 3 contiguous pixels in the BVRI(K) band chi-squared combined
image must be greater than 1.0 times the RMS of the background.
The near right uses BVRIK, the far right only BVRI. There are only minute differences between the two graphs. |
 |
 |
| The detection criteria for the graphs to the right are: 3 contiguous
pixels in the BVRI(K) band chi-squared combined image must be greater
than 2.0 times the RMS of the background.
The near right uses BVRIK, the far right only BVRI. Again, both graphs are very similar. |
 |
 |
Conclusions:
|