Chandra Deep Field South: ISAAC data

Summary:
The ISAAC infra data on the Chandra Deep Field South has been reduced in a manner homologous to the method by which the ACS data was reduced.
Processing:
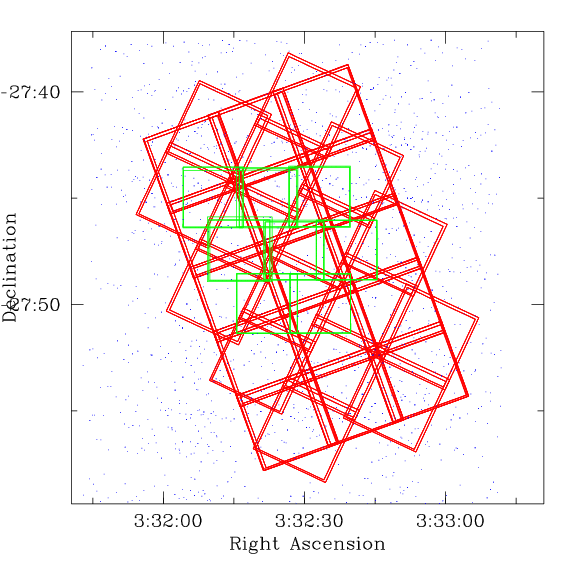
The data were retreived from The ESO website. The data at this site are detrended (flat-fielded and so on). Each image is roughly 4000x4000 pixels. There are 15 pointings in all, with partial overlaps, as shown by the figure below. The images have also been calibrated photometrically. The obsevations are in 3 filters: J,H Ks, roughly equivalent to BVIZ).

In order to generate a complete catalog, all the images in each band were combined using Emmanuel Bertin's SWarp program into one big image. The resulting images have identical World Coordinate Systems and are registered to each other with sub-pixel accuarcy. SExtractor was run in double-image on the images to generate an I-band selected catalog. The ACS data has also been SWarped on the same system. These images, although still very deep, are undersampled. The total area covered by the ISAAC data is:

BandArea
(sq. deg.)
Area
(sq. min.)
J 0.0151 54.4
H 0.0153 55.1
Ks 0.0154 55.6


The figure at right shows the layout of ACS imaging data for the Chandra Deep Field South for the first three epochs. The red boxes show the data from the Advanced Camera for Surveys on HST. The green boxes show the layout of the GOODS images taken with ISAAC in the JHK bands. The blue points indicate objects which have been observed with VIMOS.
The limiting magnitude for all three filters has been determined by examining at which point the number counts turn over and at which point the false postive detection rate exceeds 10 percent. The figures at right show this information for each band. In each figure, the black points show the number counts, with reference to the left-hand vertical axis, the red line shows the false-positive detection rate with reference to the right-hand vertical axis anc the blue line shows the limiting magnitude. The following table summarizes the information.
BandLimiting
Magnitude
J24.5
H24.0
K24.0
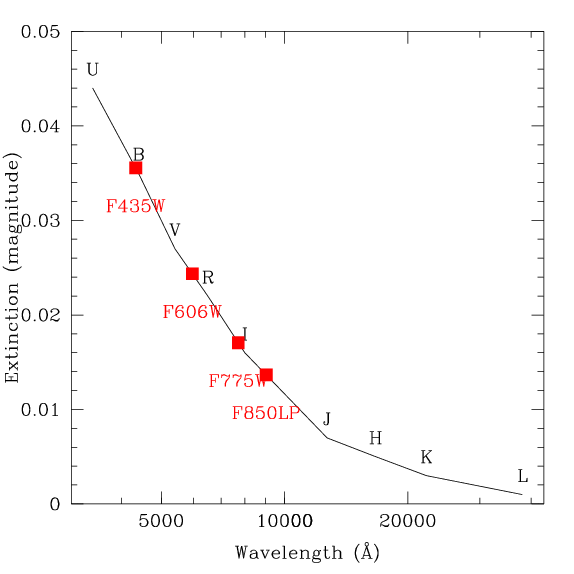
The galactic extinction for the CDFS galaxies is quite small. The following data have been taken from the NASA/IPAC Extragalactic Database and are ultimate taken from Schlegel, Finkbeiner and Davis. (1998 ApJ, 500, 525S) The figure at right shows extinction as a function of wavelength for the position of CDFS, as taken from the NED website for the usual UBVRIJHK filters. The values for the ACS filters are measured by interpolation from this graph and given in the following table:

BandCentral
Wavelength
Galactic
Extinction
J1.20.007
H1.60.005
K2.20.003


Send comments/suggestions/problems to
Stephen.Gwyn@oamp.fr