| Summary:
The ACS data from the HST for the CDFS have been reduced, including the fifth and final epoch. There are data in the BVIZ bands. The observations extend to about IAB=27. |
| Processing:
The data were retreived from ftp://archive.stsci.edu/pub/hlsp/goods/. The data at this site are detrended (flat-fielded and so on) and drizzled on a pointing by pointing basis. Each image is roughly 4000x4000 pixels. There are 15 pointings in all, with partial overlaps, as shown by the figure below. The images have also been calibrated photometrically. The obsevations are in 4 filters: (F435W, F606W, F775W, F850LP, roughly equivalent to BVIZ). The World Coordinate System of the images has been computed to a fairly high accuracy (better than 1 pixel, or 0.05 arcseconds). However, the images are not aligned in terms of pixel coordinates, and are not taken at the same position angle. In order to generate a complete catalog, the 15 images in each band were combined using Emmanuel Bertin's SWarp program into one big image. The resulting images have identical World Coordinate Systems and are registered to each other with sub-pixel accuarcy. SExtractor was run in double-image on the images to generate an I-band selected catalog. The the total exposure times are given in the following table:
The total area covered by the ACS data is 0.0511 square degrees or 184 square arcminutes, compared to ~4 square arcminutes for each of the Hubble Deep Fields. The final combined images are each about 1.2 Gigabytes. I have not put them on this website, however if you send me an e-mail at Stephen.Gwyn@oamp.fr we can see what can be done. |
| The figure at right shows the layout of ACS imaging data for the Chandra Deep Field South for the first three epochs. The red boxes show the data from the Advanced Camera for Surveys on HST. The green boxes show the layout of the GOODS images taken with ISAAC in the JHK bands. The blue points indicate objects which have been observed with VIMOS. | |
|
The figure at right shows the I-band CDFS number counts for 1, 3 and 5 epochs. The single epoch number counts are shown in black while the counts for 3 combined epochs are shown in red, and the counts for all 5 combined epochs are shown in blue. The counts are normalized to slightly different areas; the area covered by the combined epochs is slightly larger than that of the single epoch. The CDFS counts have been have corrected for the cosmic rays in the image by throwing out all objects whose half-light radius is less than 1.35 pixels. The false detection rate was calculated by taking the original image, mutliplying by -1 and run SExtractor on this negative image with the original parameters. Since the image is negative, all detections are perforce false. The resulting number counts divided by the true number counts measured from the positive image give the false detection rate. The false detection rates for the two epochs are shown as solid lines on the graph. The limiting magnitude would appear to be about IAB=27, as this is where the counts start to turn over and where the false detection rate is 10%. |
 |
| The figure at right shows the I-band CDFS number counts, toghether with counts from other surveys. Some of the data on this graph has been taken from Nigel Mecalfe's number counts webpages. |  |
The data was taken in the BVIZ bands, or more precisely
the F435W, F606W, F775W and F850LP bands. The throughput of these
filters are shown in the figure at right, together with the
system (mirrors, CCD window, CCD quantum efficiency) for the ACS
camera. The heavy lines show the total throughput for each
filter (filter response multiplied by system response).
These data are taken from
the HST website.
The band passes are available in ascii format
(two columns: wavelength in Angstroms and transmittance)
from the following links:
|
|
The limiting magnitude for all four filters has been determined
by examining at which point the number counts turn over and at
which point the false postive detection rate exceeds 10 percent.
The figures at right show this information for each band.
In each figure, the black points show the number counts,
with reference to the left-hand vertical axis,
the
red line shows the false-positive
detection rate with reference to the right-hand vertical axis
anc the blue line shows the
limiting magnitude.
The following table summarizes the information.
|
|
The galactic extinction for the CDFS galaxies is quite small.
The following data have been taken from the
NASA/IPAC Extragalactic Database
and are ultimate taken from
Schlegel, Finkbeiner and Davis.
(1998 ApJ, 500, 525S)
The figure at right shows extinction as a function of
wavelength for the position of CDFS, as taken from the NED
website for the usual UBVRIJHK filters. The values for the
ACS filters are measured by interpolation from this graph and
given in the following table:
Note that there may be variations in extinction across the field. |
|
|
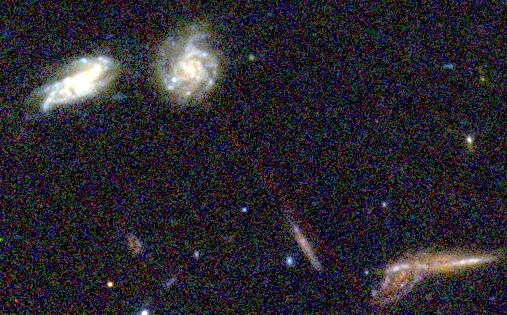
The image below shows an esthetically pleasing
area. A number of spiral galaxies are visible at
several inclination angles in suggestive poses.
|
|