Photometric redshifts with CFHTLS and WIRCam

Summary:

This page describes the photometric redshift accuracy that can be expected with WIRCam data on the CFHTLS Deep Fields. The results show that while some IR data greatly improves the photometric redshifts at high redshift, not all the possible WIRCam filters (YJHK) are necessary: J and K are sufficient.

A secondary result shows that almost every galaxy detected to the WIRCam limit in K will also be detected in the CFHTLS I band, but the reverse is not true. In general, concerns are raised about the detection of galaxies at high redshifts with intrinsic spectra redder than the typical Lyman break galaxy SED.

Method:

A Monte Carlo type simulation was used. Galaxies of the full spread of spectral types (as described here) were used. These spectra were redshifted from z=0 to z=6. The spectra were multiplied by the CFHTLS and WIRCam bandpasses to produce photometry. The photometry was renormalized so that the K magnitude was close to the WIRCam survey limit of K=23.4 AB mags. Noise was added to photometry to simulate observational errors. If the resulting magnitude was below the detection limit in a given band, it was flagged as "undetected" in the simulated catalog. The assumed magnitude limits are given in the following table in AB mags. The WIRCam limits are from the "straw man" description of the survey, while the CFHTLS limits represent the current limits of the survey.

u g r i z Y J H K
26.0 26.0 26.5 26.5 24.0 23.8 24.0 23.6 23.4

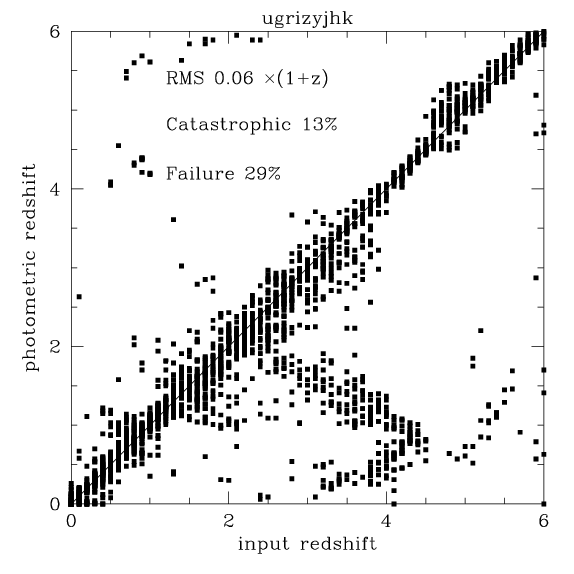
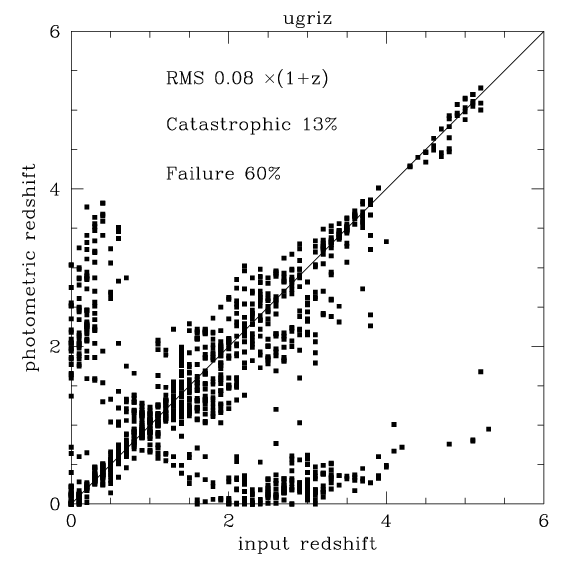
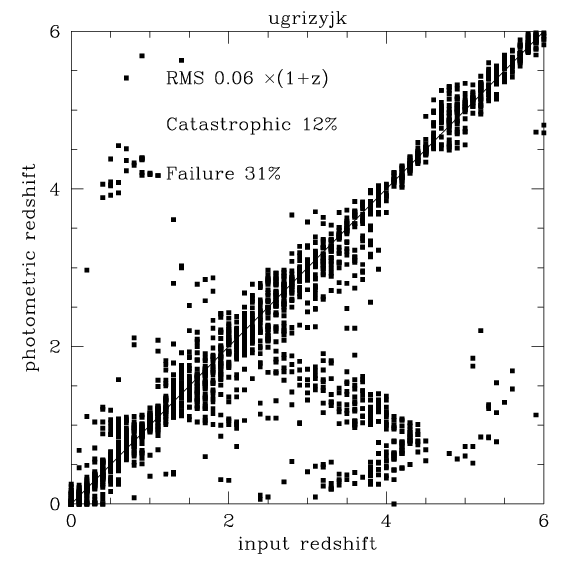
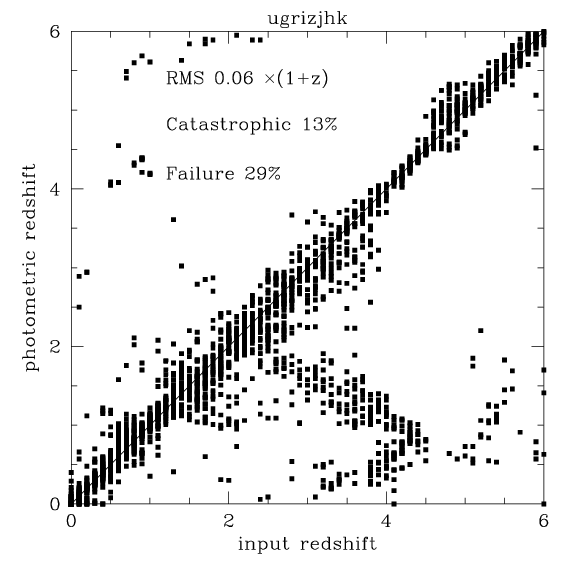
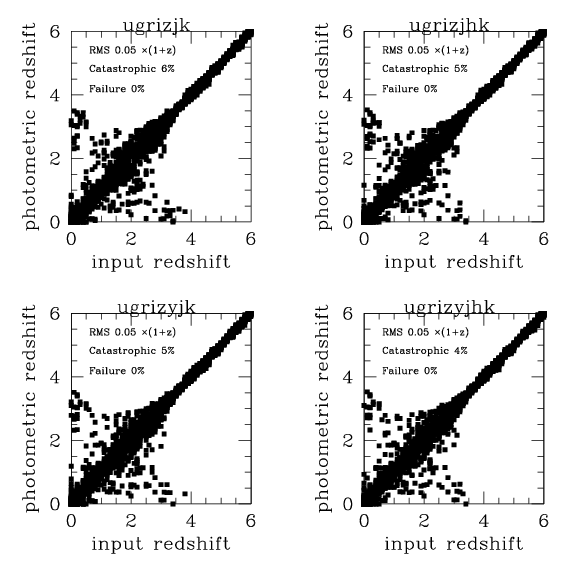
The resulting simulated catalog was run through the usual template fitting photometric redshift code.

Two samples were generated one "K=23.4 selected" on "I=26.5 selected". 
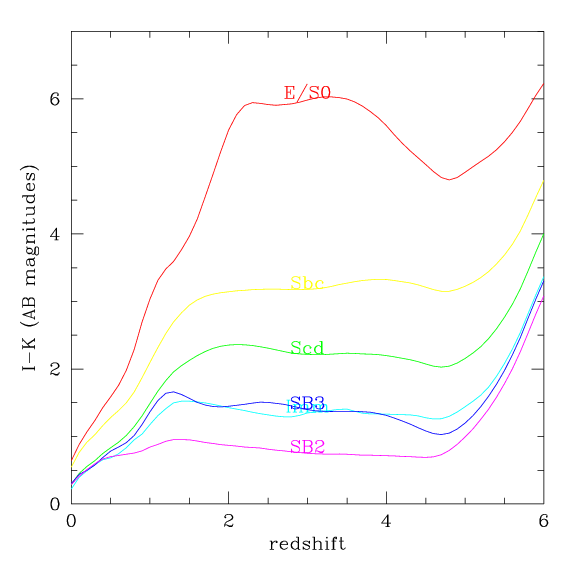
As it turns out, because the typical colour of high redshift galaxy is bluer than I-K=3, galaxies at the I-band detection limit are rarely detected in K. This sample was not studied any further.

Results:

The following table shows the photometric redshift accuracy predicted by this method, as function of the filter set. Photometric redshift error distribution are rarely Gaussian. Usually, there is a fairly tight Gaussian core, and the a number of "catastrophic" failures where the photometric redshift is considerable different from the true redshift. In the table below: "RMS" indicates the expected error when the photometric redshift hasn't failed catastrophically. The catastrophic failure rate is the fraction of galaxies where the derived photometric redshift is more than 10% off from the input redshift. It is impossible to compute a photometric redshift when the input photometry consists of only two bands, that is to say, only one colour. A minimum of 3 bands are required. When the intrinsic colours of a galaxy in the simulated catalog were such that it would only be detected in two or fewer bands, it was designated a complete failure. This is typically the case for early-type galaxies at high redshifts.
Filter set RMS Catastrophic
Failure
Complete
Failure
ugrizYJHK0.0613%29%
ugriz 0.0813%60%
ugrizYJK 0.0612%31%
ugrizJHK 0.0612%31%
ugrizJK 0.0612%31%


The "complete failure" rates from the table above may seem high. However consider the figure at right. It shows I-K colour of galaxies as a function of redshift. It shows that, for z>1.5, for galaxy types redder than Sbc, I-K>3 fairly typical. This means that galaxies at the K limit of 23.4 may not be detected even in the CFHTLS i-band which extends the deepest. However, the complete failure column in the table below is probably an over estimate. At z>1, it is unlikely that there will be many intrinsically red galaxies.

The figure at right shows photometric redshifts computed using the ugrizYJHK filter set. Note the number of catastrophic failures with input redshifts around z=3.5 with photometric redshifts around z=1. The reason for the failures is explained by the following figure.

This figure shows a typical catastrophic failure. The figure shows AB magnitude (or, if you like, flux in Janskys) as a function of wavelength. The black line shows the original input spectrum (z=4.4) The blue shows the spectrum selected by the photometric redshift (z=0.93). The photometry from the simulated catalog is shown by points with error bars if the galaxy was detected, by upper limits otherwise. Down to the projected limit of the WIRCam+CFHTLS survey, the galaxy in question is only detected in 3 bands: CFHTLS br and WIRCam K. As one can see, templates at z=4.4 and z=0.93 fit equally well. In order to break this degeneracy, one needs either deeper imaging in J or H, or alternatively deeper imaging in either u or g. Note this degeneracy is only a problem for non-starbursting galaxies. The typical Lyman break galaxy SED is an intrinsically fairly flat spectrum with a break imposed by the intergalactic medium. This is, after all, the principal reason behind the Lyman break method. What the simulations are showing is that if a high redshift galaxy is intrinsically slightly red, it may be difficult to pin down its redshift with any accuracy.

The figure at right shows photometric redshifts computed using only the CFHTLS ugriz filter set. It shows why the photometric redshift measurements discussed at length here only extend to z=1.5.

The figure at right shows photometric redshifts computed using only the CFHTLS ugriz plus WIRCam YJK filter set. Leaving out H has a negligible effect on the quality of the photometric redshifts.

The figure at right shows photometric redshifts computed using only the CFHTLS ugriz plus WIRCam JHK filter set. Leaving out Y has a negligible effect on the quality of the photometric redshifts.

The figure at right shows photometric redshifts computed using only the CFHTLS ugriz plus WIRCam HK filter set. Leaving out both Y and H has a negligible effect on the quality of the photometric redshifts.

The effect of limiting mags:

The plot at right shows photometric redshift vs. input redshift for a variety of filter sets. The difference between these and the above plots is that these plots do not take into account the limiting magnitude of the survey. That is to say, the galaxies are assumed to be detected in every band. Because of the extra photometric information, the plots look a lot better than ones above. They still indicate, however, that the exact mix of IR bands is not important.