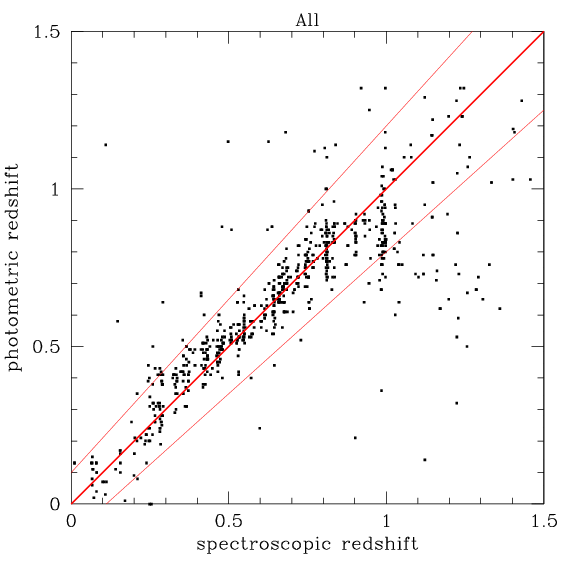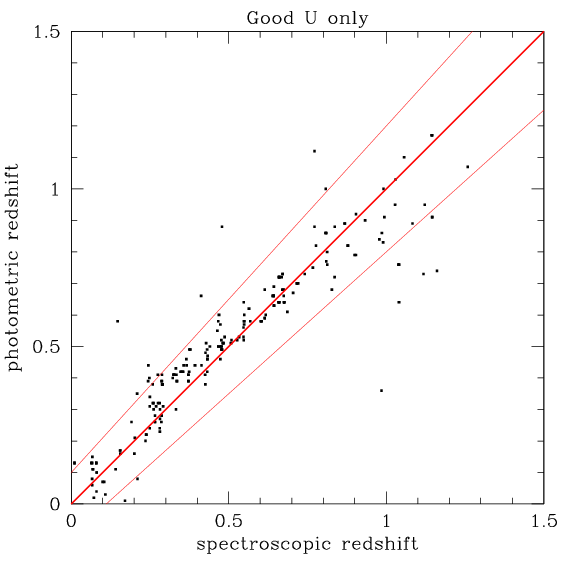
The two figures at right show z_phot vs z_spec for the D3 field.
The upper one show the results for all the objects
with spectroscopic redshifts. The lower one
shows the results for galaxies which have at least a 5-sigma
detection in the U-band.
The
heavy red line shows the
z_phot=z_spec relation. The lighter lines show +/- 10% in (1+z).
The match between z_phot and z_spec is quite good
for the ugriz data and fairly good when only the griz
bands are used. The match is significantly better than the
pre-Elixir version of these graphs as shown
on this webpage, as
predicted by simulations.
hile overall the match is quite good, there are a
few imperfections.
There is a slight (0.05 in z) offset around z=0.5.
This is due to the systematic zero-point uncertainties
discussed earlier.
There is also more scatter at z>1 than is really desirable.
This is unavoidable, unless we get some more long wavelength
coverage.
Finally, there are a few ''catastrophic'' failures, where
the photometric redshift shows a significant offset from
the corresponding spectroscopic redshift. Some of these are
due to bad degeneracy in the colour-redshift relations, but
a significant fraction may be due to poor spectroscopic redshift
identifications. If one cross-references the CFRS, DEEP and DEEP2
redshift catalogs, one find that there is a certain fraction
of the spectroscopic redshifts which are discrepant.
ere is a slight (0.05 in z) offset around z=0.5.
This is due to the systematic zero-point uncertainties
discussed earlier.
There is also more scatter at z>1 than is really desirable.
This is unavoidable, unless we get some more long wavelength
coverage.
Finally, there are a few ''catastrophic'' failures, where
the photometric redshift shows a significant offset from
the corresponding spectroscopic redshift. Some of these are
due to bad degeneracy in the colour-redshift relations, but
a significant fraction may be due to poor spectroscopic redshift
identifications. If one cross-references the CFRS, DEEP and DEEP2
redshift catalogs, one find that there is a certain fraction
of the spectroscopic redshifts which are discrepant.
|


|
 Where m is the magnitude,
F is the flux and
F0 is the flux zeropoint of the filter in
question.
This produces a coarse spectral energy distribution (SED).
Following flux zeropoints were used (in units of W/m2/Angstrom):


