Dark Matter Maps from Weak Lensing

Image taken from http://www.cfht.hawaii.edu/News/Lensing/
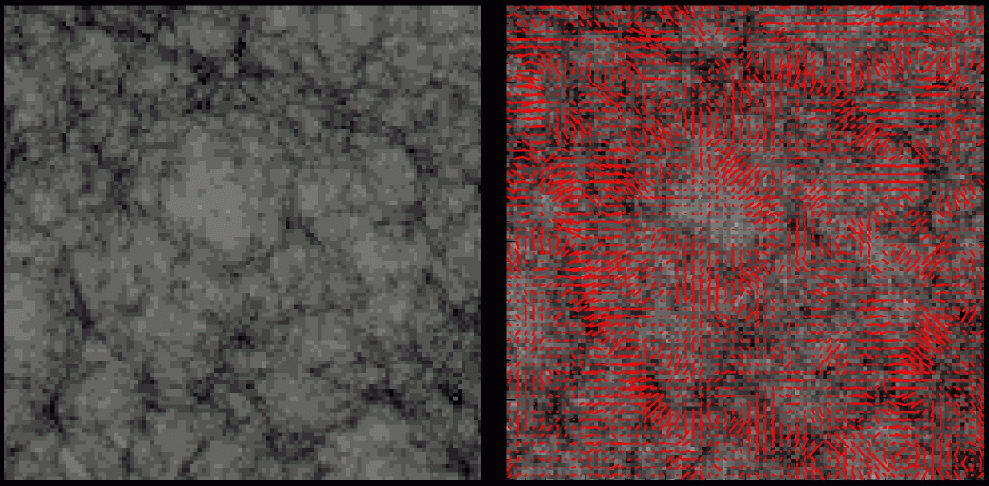
The left panel of this image show another computer simulation of dark matter - this time, a darker colour represents an area of denser dark matter. The right panel shows a weak lensing map overlaid on the dark matter distribution. The length of each red line shows the strength of the lensing - a longer line means the dark matter has lensed light more. The direction of the red lines shows the direction of the lensing - the lensing happens at right angles to the filaments of dark matter. The overall effect of all the weak lensing measurements - all the red lines - is a map of the underlying dark matter distribution.