Zero-points for VIRMOS CFH12K data

Summary:
This page is a study of zero-points of the VIRMOS imaging data taken with CFH12K. The nightly zero-points have been recomputed when possible. The evolution of the zero-points is followed and the consistency is examined.
Rationale: The CFH12K imaging data for the VVDS was taken over a span of several years and calibrated in a somewhat heterogenous manner. This page rexamines the available calibration data. This page draws heavily on information presented at the following websites:
By querying the CADC website for observations of the Landolt standard star fields taken during the VIRMOS runs, a comprehensive list of calibration observations was drawn up. This list was cross referenced with the detrended data currently on the TERAPIX disks. By no means all of the data taken is on the disks. Although all this data is in fact available from CADC, it is in raw form. In order to use it, it would have to be detrended, a time consuming process. Also, the volume of data is considerable, making transfer times prohibitive.

The detrended data was calibrated astometrically with the AstroGwyn pipeline in an automatic fashion. SExtractor was run on the images to produce photometric catalogs. The objects in this catalog were cross-referenced with the catalog of Landolt standard stars to produce a list of observations. The list contains the exposure time and airmass information taken from the header, the instrumental magnitude and the

A number of the standard star observations were taken with the telescope delibrately out of focus, to avoid saturating the detector on the brighter stars. These images can not be processed in an automatic way and were therefore ignored in the interests of expediancy. Further any SExtractor catalog entry with a non-zero flag was omitted. This avoids staturated stars as well as any other peculiarities.

Once full list of standard star observations with is compiled, the zero-points were computed. The zero-points were determined by the following two methods

  • Zero colour zero-points:
    • The colour terms and extinction coefficients from the Elixir pages is assumed. These data are repeated in the table below.
    • The instrumental magnitude, -2.5*log10(flux) is corrected for:
      • Colour term: this is based on the Landolt standard colours NOT the instrumental colours
      • Exposure time: 2.5*log10(exposure time in seconds)
      • Airmass:
      Thus we have:
      mag_instrumental =  -2.5*log10(flux)
            
      mag_instrumental_corrected = -2.5*log10(flux)
                                 + colour_term * colour
                                 + 2.5 * log10(exposure time) 
                                 - (extinction coefficient) * (airmass)
      		  
    • The difference between the correct instrumental magntiude and the magnitude of the Landolt standard gives one measure the zero-point.
      zero-point = Mag_Landolt - mag_instrumental_corrected
      
    • For a given night, one takes the median of all the zero-points calculated.
    • Since the procedure takes the colour term into account it gives the zero-point at zero colour.
  • Median colour zero-points: In this procedure, the colour term is ignored.
    • The instrumental magnitude, -2.5*log10(flux) is corrected for:
      • Exposure time: 2.5*log10(exposure time in seconds)
      • Airmass:
      Thus we have:
      mag_instrumental =  -2.5*log10(flux)
            
      mag_instrumental_corrected = -2.5*log10(flux)
                                 + 2.5 * log10(exposure time) 
                                 - (extinction coefficient) * (airmass)
      		  
    • The difference between the correct instrumental magntiude and the magnitude of the Landolt standard gives one measure the zero-point.
      zero-point = Mag_Landolt - mag_instrumental_corrected
      		  
    • For a given night, one takes the median of all the zero-points calculated.
    • Since the colour term is ignored, and since (in general) there really is one, this procedure gives the zero-point at the median colour of the standard stars used in the calculation.
The following table gives the extinction coeffincients and colour terms from the Elixir web page.
FilterExtinction
coeffecient
Colour
term
Colour
B 0.15 0.016 B-V
V 0.12 0.008 V-R
R 0.09 0.028 B-V
I 0.04 0.107 R-I
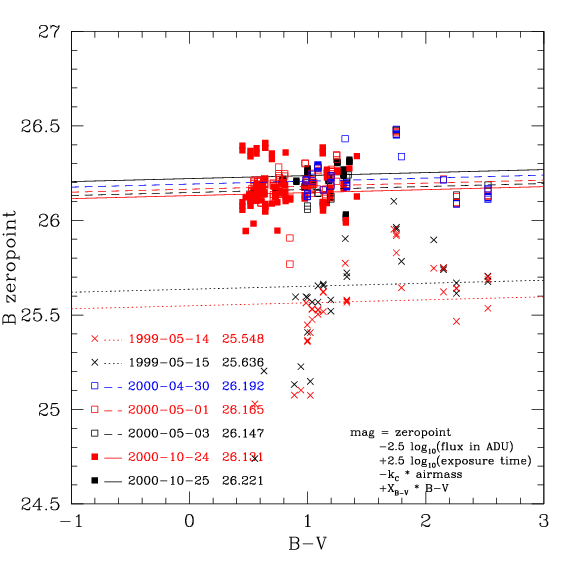
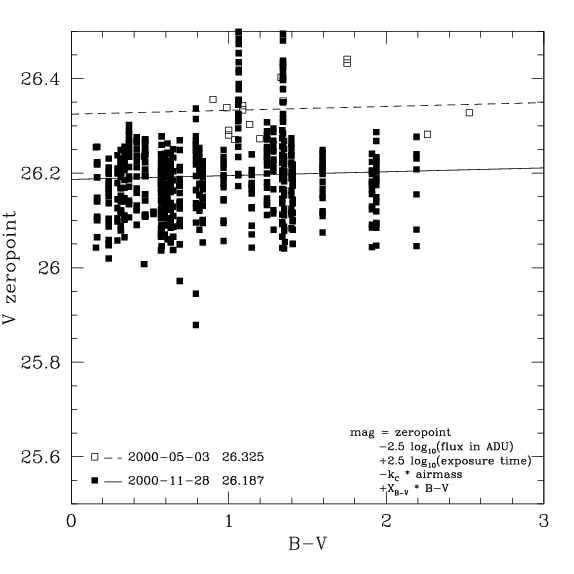
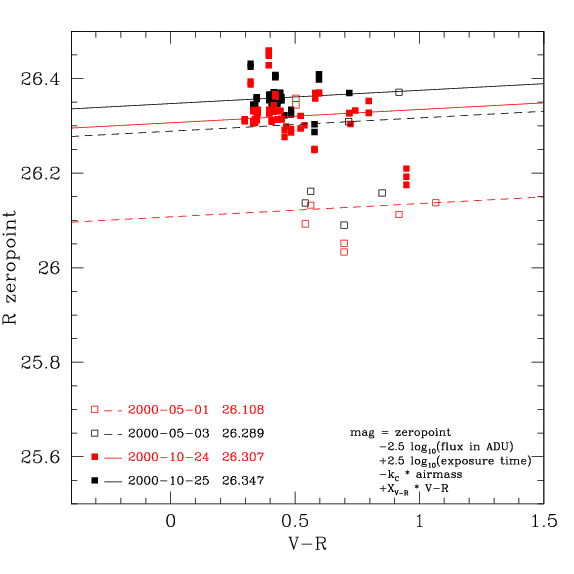
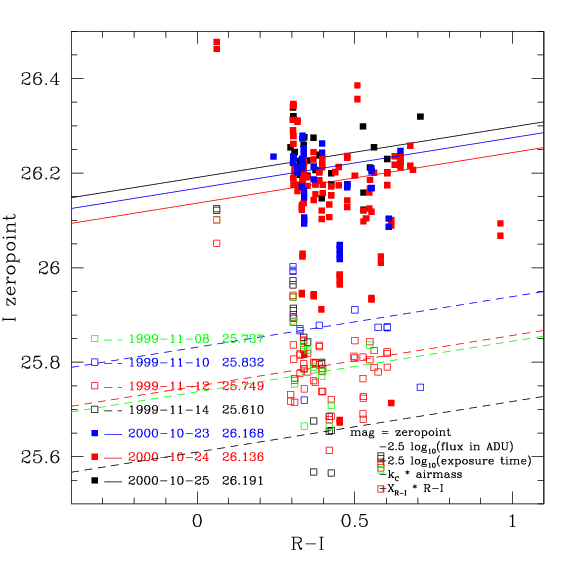
The following 4 graphs show calculations of the zero-point for the BVRI bands. In each graph, zero-point is plotted against Landolt colour. Each point corresponds to one observation of one Landolt standard star. Each zero-point is computed in the Vega system. Each night is plotted in a different colour or symbol as shown on each graph.

The lines show the zero-points. The colour terms from the table above determine the slope of the lines. In order to comput the intercept of the lines, the colour term is applied to all individual the zero-points, as described above. The median of the residuals give the zero-point at colour=0. The colour term is significant in the I band only. The zero colour zero-points for each night are noted on each graph.

The following table gives the zero-points calculated by both the zero-colour and median colour methods. The median colour zero-point is the type of zero-point that has been used throughout the VIRMOS CFH12K data reductions. This is probably sub-optimal, since there is a significant colour-term in the I band. However, as the last column of the table shows, the difference is only 0.04 magnitudes.
FilterDateZero-point
(Colour=0)
Median
colour
Zero-point
(Median Colour)
Zero-point
Difference
B1999-05-1425.5481.31925.5670.019
B1999-05-1525.6361.31925.6550.019
B2000-04-3026.1921.19726.2100.018
B2000-05-0126.1650.78426.1770.012
B2000-05-0326.1471.19726.1840.037
B2000-10-2426.1310.71526.1450.014
B2000-10-2526.2211.18126.2420.021
V2000-05-0326.3251.13326.3340.009
V2000-11-2826.1870.81426.1940.007
R2000-05-0126.1080.69726.1320.025
R2000-05-0326.2890.69726.3090.020
R2000-10-2426.3070.42926.3230.017
R2000-10-2526.3470.42126.3570.010
I1999-11-0825.7370.36925.7800.043
I1999-11-1025.8320.38725.8740.042
I1999-11-1225.7490.38725.7900.040
I1999-11-1425.6100.35025.6560.045
I2000-10-2326.1680.33926.2100.042
I2000-10-2426.1360.39626.1770.040
I2000-10-2526.1910.37526.2300.039
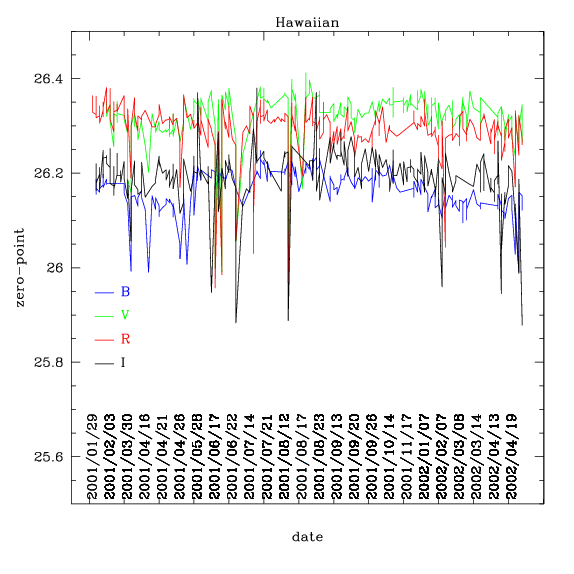
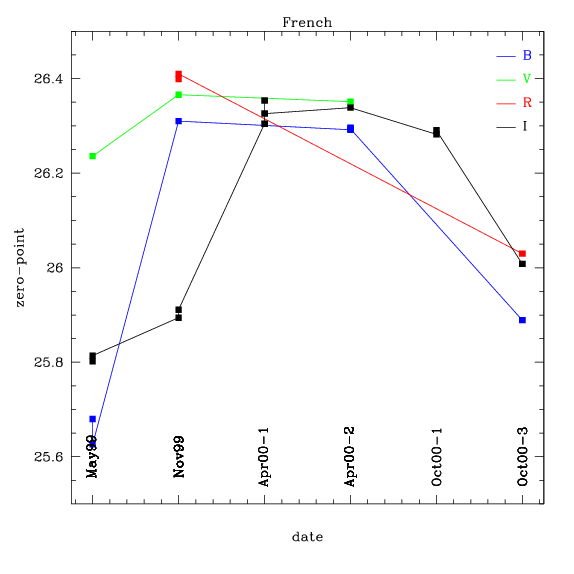
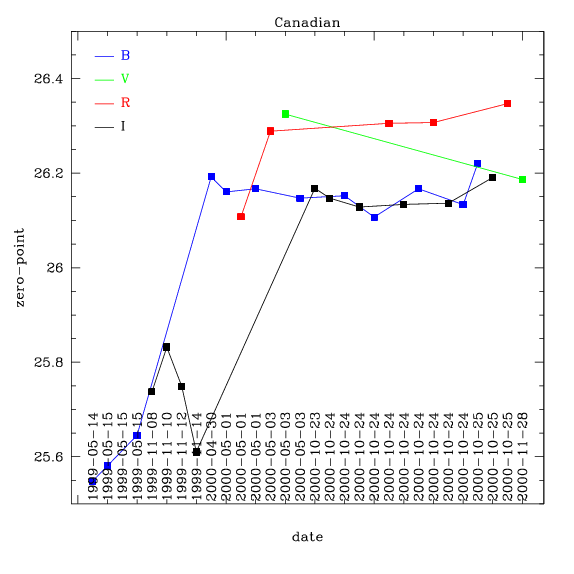
Zero-point evolution: The following three plots show the evolution of the CFH12K zero-points in the BVRI bands as a function of time. In each plot the bands are denoted by colour as follows:
  • B: blue
  • V: green
  • R: red
  • I: black
Note that the plots do not cover the same time frame. The zero-points are plotted in the Vega system and at zero colour and zero airmass.
The data from the Elixir page. There are occaisonal downward spikes corresponding to nights with high opacity, but on the whole the zero-points are remarkably constant, easily to within 0.1 magnitudes over the whole period. The V and R zero points are roughly equal to each other, and about 0.15 magnitudes deeper than the B and I zero-points, which are also about equal. This makes sense, given that the quantum efficiency of the detectors peaks in the central wavelengths and decreases to the blue and red ends of the spectrum. (Note that the zero-points given on the Elixir are given at airmass=1 and have been corrected here to airmass=0)
The data from the VIRMOS/Descart webpage. Note that the exact dates are not available. Zero-points are calculated on a run-by-run rather than a date-by-date basis. There is a break in the zero-points between May99 and Nov99 corresponding to a change in the gain of the detectors. The Oct00-3 zero-points show a large unexplained dip. The B and I zero-points for Nov99 are very disimilar, at odds with their behaviour at later dates.
These data come from the present calculations.

After the 1999 gain change, the behaviour of zero-points are mostly consistent with the Elixir data. The BI zero-points are about 0.15 mags fainter than the VR zero-points. The notable exception is the V zero-point from 2000-11-28