| Summary:
The ACS data from the HST for the CDFS have been reduced, including the third epoch. . There are data in the BVIZ bands. The observations extend to about IAB=26.5 |
| The basic reduction steps are reported on this web page. This page only reports the new developments. |
| Processing:
The data were retreived from ftp://archive.stsci.edu/pub/hlsp/goods/. For some reason there does not appear to be any new B-band data. All the data for each of the BVIZ bands were combined using SWarp. The the total exposure times are given in the following table:
|
| The figure at right shows the layout of imaging data for the Chandra Deep Field South for the first three epochs. The red boxes show the data from the Advanced Camera for Surveys on HST. Note that epoch 3 is almost, but not quite, on top of epoch 1. The blue points indicate objects which have been observed with VIMOS. | |
|
The figure at right shows the I-band CDFS number counts for both epochs. The single epoch number counts are shown in black while the counts for the combined epochs are shown in red. The counts are normalized to slightly different areas; the area covered by the combined epochs is slightly larger than that of the single epoch. The CDFS counts have been have corrected for the cosmic rays in the image by throwing out all objects whose half-light radius is less than 1.35 pixels. The false detection rate was calculated by taking the original image, mutliplying by -1 and run SExtractor on this negative image with the original parameters. Since the image is negative, all detections are perforce false. The resulting number counts divided by the true number counts measured from the positive image give the false detection rate. The false detection rates for the two epochs are shown as solid lines on the graph. The limiting magnitude would appear to be about IAB=26.5, as this is where the counts start to turn over and where the false detection rate is 10%. |
 |
| The figure at right shows the I-band CDFS number counts, toghether with counts from other surveys. Some of the data on this graph has been taken from Nigel Mecalfe's number counts webpages. |  |
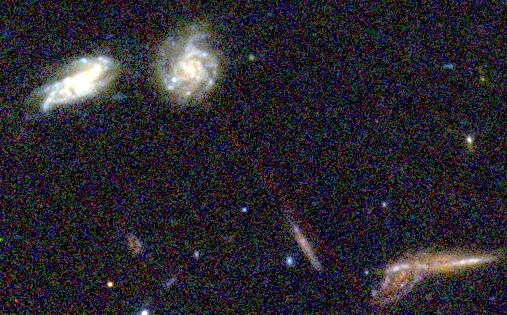
The image below shows an esthetically pleasing
area. A number of spiral galaxies are visible at
several inclination angles in suggestive poses.
|