Adaptive star-galaxy separation

Summary:  The seeing varies significantly in the VVDS wide fields. Because of these variations, an adaptive method must be used to separate stars from galaxies.

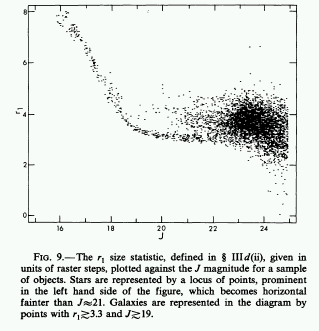
The usual way to do star-galaxy separation for a given catalog is to plot the radius ( R-2 or the half-light radius) of the objects in the catalog against their magnitudes. The locus of point-sources on this plot can be identified as an over-density in the magnitude-radius plane. This illustrated at right top with a figure from Kron (1980)

In general, this locus is very obvious and the stellar sequence can be identified by hand. Cuts in magnitude and radius can be made to identify stars. However, in the case of the VVDS fields, the data was taken over several observing runs and under different seeing conditions. As the seeing changes the location of point sources on the radius-magnitude plane will change.

Complicating matters, the VVDS images have been mosaiced into one large image. The seeing varies accross this image from about 0.6 to 1.0 arcsecond. This web page describes how the star-galaxy separation for F22 I band frame were generated. To sumarize:

  • The seeing is measured accross the image.
  • Regions of similar seeing are grouped together
  • The stellar locus is automatically identified within these regions
  • Objects within the stellar locus are flagged as stars.
Measuring the seeing

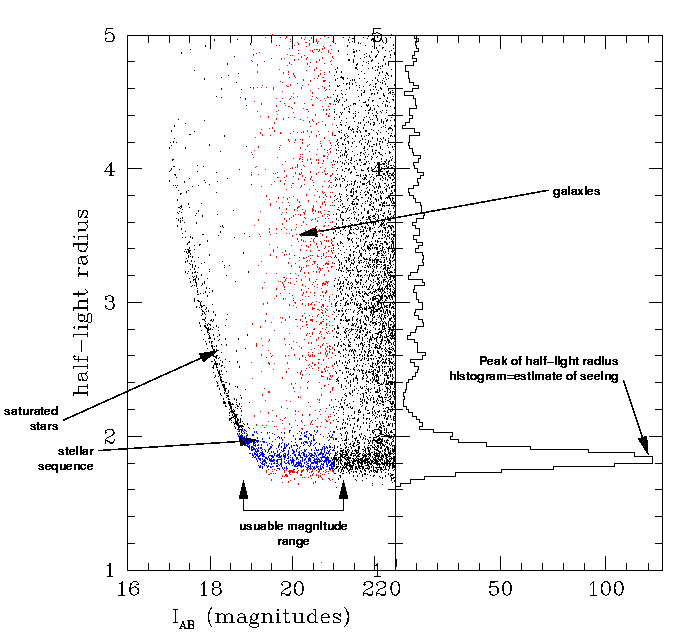
Since we need to measure the seeing accross 4 square degrees at numerous intervals, we need a method of measuring the seeing that is completely automatic. The procedure follows from the usual method of identifing the stellar locus in as much as the first step is to plot half-light radius against magnitude. Generally speaking, a radius-magnitude plot shows a well defined and fairly tight stellar sequence near the bottom while the galaxies are scattered widely throughout the top of such a plot. At bright magntiudes, the stellar sequence turns up (larger radii) as the stars become saturated. The exact point of this upturn depends on the exact stallar profile and the size of the full well of the CCD with which the star was observed. At faint magntiudes, the stellar sequence merges becomes indistinguishable from the galaxies. Therefore, the next step is to select a magnitude range in which the stellar sequence is obvious under most seeing conditions. This is a rather ad hoc procedure. Then, the distribution of half-light radii of the objects in the selected magnitude range is plotted as a histogram. This histogram will show a peak at the small end (the stars) followed by an extensive tail out to large radii (the galaxies). The peak of the distribution is a fairly robust measure of the seeing. (Of course "half-light radius" is not the same things as "Full width half max" the usual measure of seeing. However half-light radius is a more useful measurement for the present exercise.) This procedure is illustrated in the following figure:

The left-hand panel shows a radius-magnitude diagram. The stellar sequence, the staturated stars and the galaxies are indicated with arrows. Objects in the usuable magntiude range are shown in red. Those in the usuable magntiude range and in the stellar sequence are shown in blue.

The right hand panel shows the distribution of half-light radii of objects in the usuable magnitude range. The peak of the histogram, is indicated with an arrow.

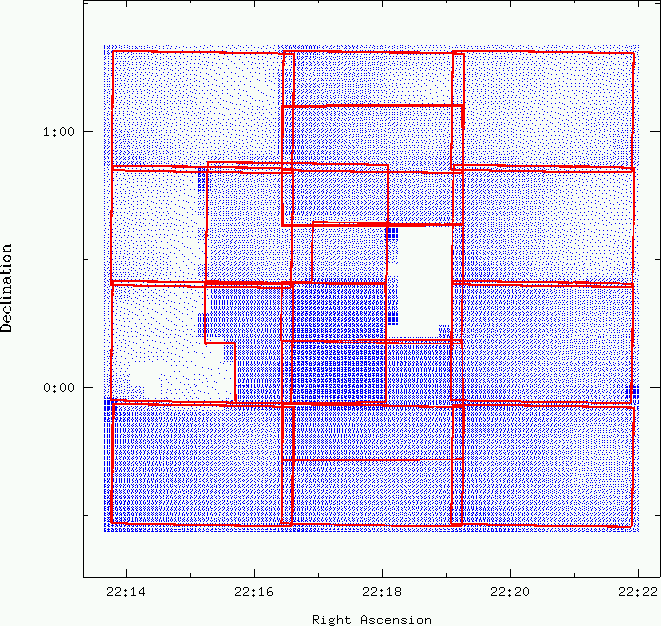
Seeing was measured using this method accross the F22I field. The following figure shows the results.

Seeing variations for the F22I data. The red outlines show the location of the original exposures. The seeing is indicated by a blue dither pattern. The denser the pattern, the better the seeing. White patches indicate regions were seeing could not be measured due to lack of data. It is apparent the seeing does vary considerably. Also it is obvious that seeing can vary greatly on a short angular scales, from one pointing to the next, depending on the epoch that the data was taken. More subtle is the variation accross a single pointing, which result from changes in the PSF accross the CFHT focal plane.

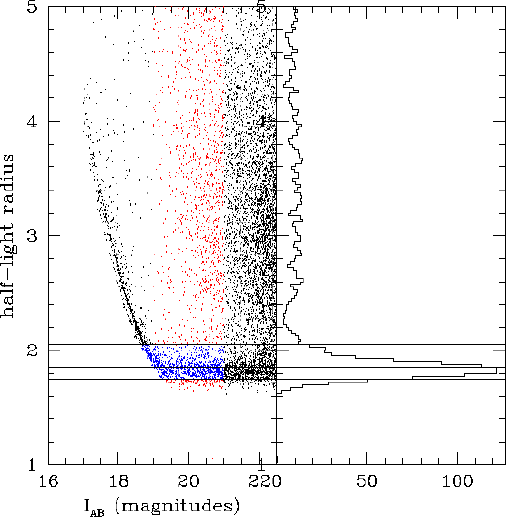
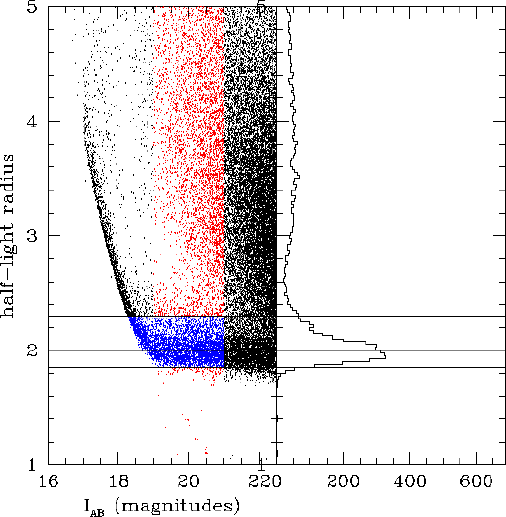
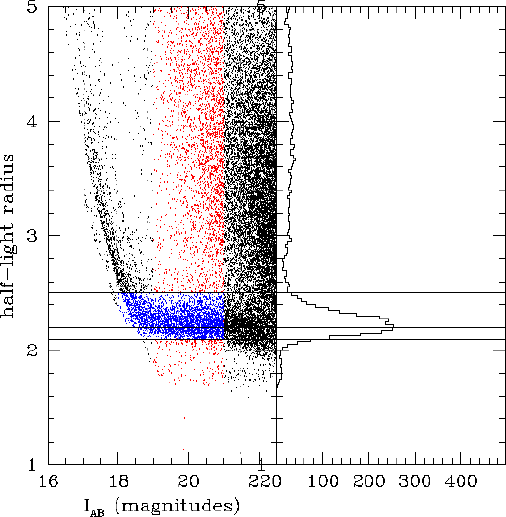
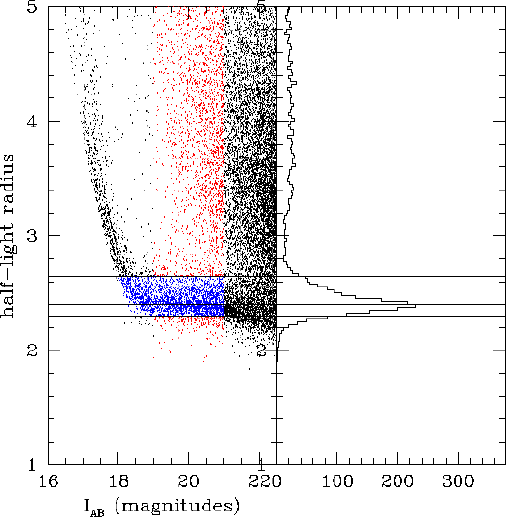
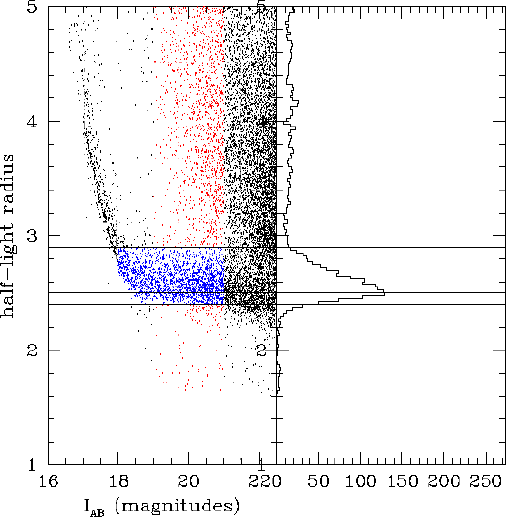
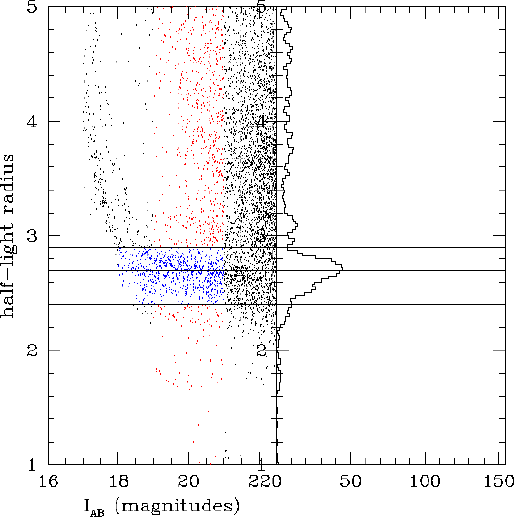
The seeing (as measured by half-light radius) was found to vary between 1.7 and 3.2 pixels (= 0.35 to 0.66 arcsec) For the rest of the analysis, all the objects in all sub-sections with the same seeing are grouped together. For each of these groups, one makes radius histograms as before. This time however, there are considerably more object in the histogram. Once centre of the stellar sequence is identified, the next step is to find the edges. The radius histogram drops off fairly sharply from the peak in both directions. Some what arbitrarily, it was decided to set the boundaries of the stellar sequence at 20% of the peak value of the histogram. Any object with in this range, from the 20% mark at the small end to the 20% mark, at the large end is deemed to be a point source.

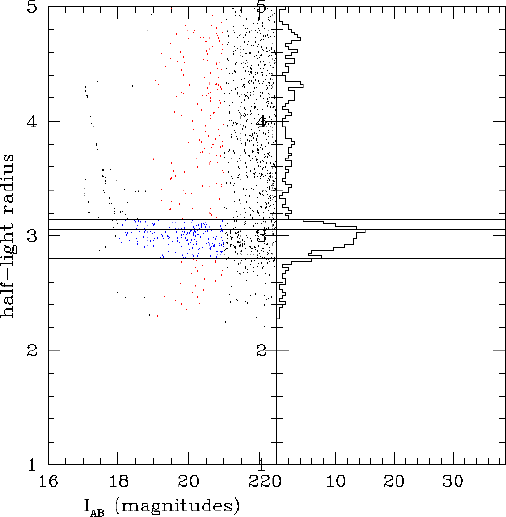
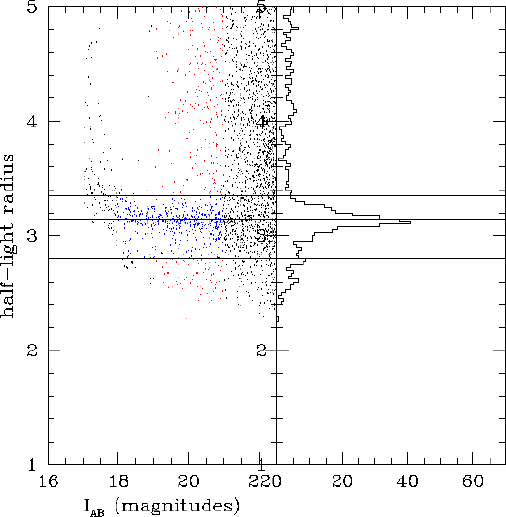
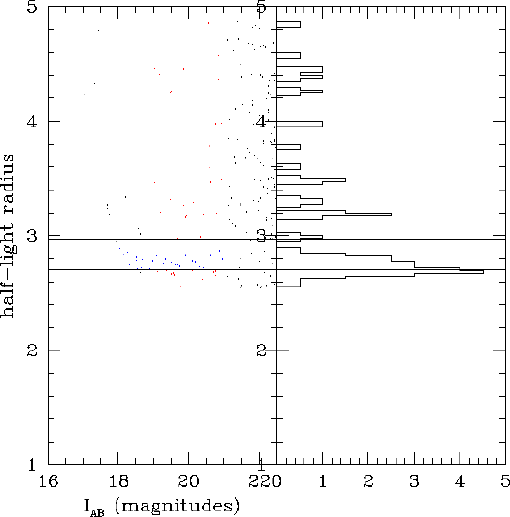
The figures at right show the stellar locus for 9 different seeing regimes. Objects in the usuable magntiude range are shown in red. Those in the usuable magntiude range and in the stellar sequence are shown in blue. The peak of the histogram and the dropoff 20% marks are shown by horizontal lines.

Conclusions:

  • Using this method, the point sources in a catalog can identified in an automatic manner even if the seeing varies.

Caveats:

  • The size of the sections on the sky used to measure the seeing has to be tuned. Making the sections to small reduces the number of the objects in each section to the point where it becomes difficult to identify robustly the peak of the histogram. If the sections are too large, the sections may span the boundary between pointings, which may have been observed under radically different seeing conditions. In this case, the histogram of the radii will be bi-modal. Identifying the peak of the histogram in this situation will be unreliable.
  • There are still 4 parameters that must be adjusted: the high and low magnitude cuts and the percentage thresholds for the the cuts on the radius histogram. These must be set in a relative ad hoc way.
  • It is still relatively difficult to extend the cuts to fainter magnitudes.