| Synopsis: The observed astrometric accuracy in the F02 VIRMOS field is compared with the theoretical limit. The observed accuracy is less than the theoretical accuracy |
| As discussed in detail here there large shifts
between reduced images of the same VIRMOS pointings taken in different
bands, at least in some patches. This web page discusses the extent
of these patches of sub-optimal astrometry and compares them to what could
be expected.
The first question is: how far off is the F02 image from the USNO standard stars. To check this, ''postage stamps'' were cut out of the F02 image around each USNO star. The centres of the object nearest the centre was found using the IRAF task centre. Those objects whose centre was found to deviate from the expected position by more than 1'' (5 pixels) were scrutinized by eye. In some cases, the deviation was genuine. In other cases, the deviation was due to the star in question being saturated. These objects were re-centred by hand. In still other cases, it was impossible to determine the centre reliably for one of a number of reasons:
|
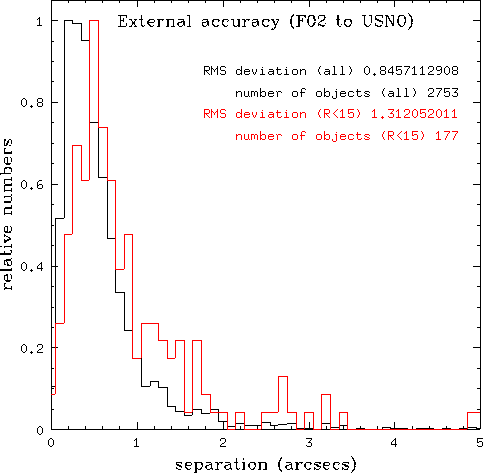
| The figure at right shows the difference in position between sources in the USNO catalog and the corresponding sources in the F02 catalog. The average difference in position is 0.85'' |  |
| The figure to the right shows the location of USNO sources as small black points. The sources in the F02 image that were found to be more than 1.5'' from the corresponding USNO source are shown as red dots. The red points are even spread across the image. | 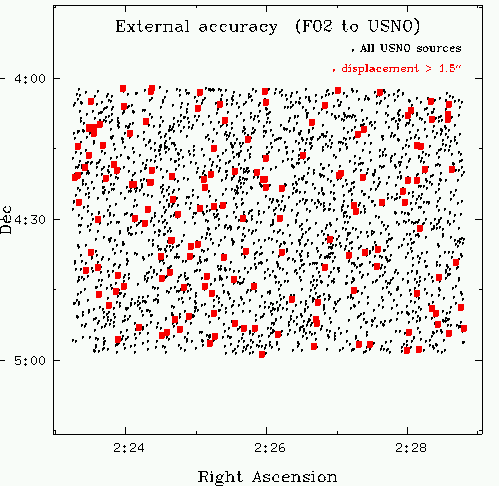 |
| Another approach to the problem is to run SExtractor on the image producing a catalog of all objects in the field. For each USNO object, one then finds the nearest object in the catalog. This produces the following result: |
| The figure at right shows the distribution of the distances from the nominal USNO positions and the position of the nearest object in the catalogs generated by SExtractor from the F02I image. USNO stars whose nearest neighbour was more than 2'' were ignored, as were objects whose second nearest neighbour was less than 5'' away. The average separation is 0.460''; he RMS separation is 0.580''. Ignoring matches with a separation greater than 1'' changes these numbers to 0.376'' and 0.435'' respectively, as shown in red. | 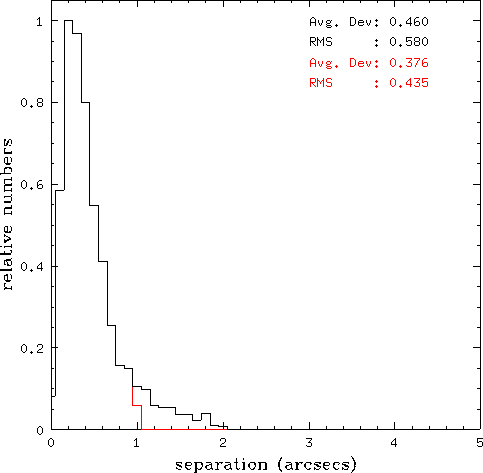 |
The internal accuracy between the bands was measured. This was done
by running SExtractor on the B and I image and comparing the positions
of corresponding objects in the two catalogs. An object in the I catalog
was deemed to match the corresponding object in the B catalog if:
|
| The figure at right shows the difference in position between sources in the USNO catalog and the corresponding sources in the F02 catalog. The RMS difference in position is 0.14'' | 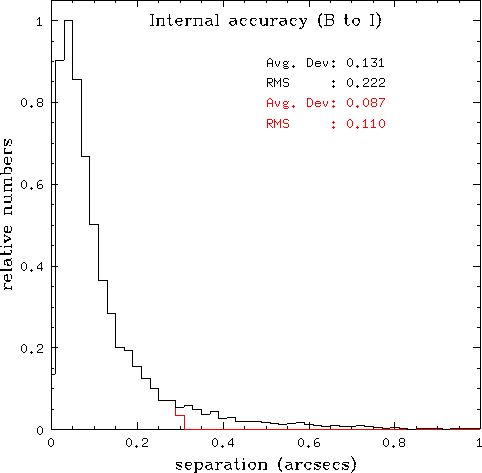 |
| The figure to the right shows the location of poor matches between the F02B and the F02I. If the difference in position between the sources is greater than 0.3'', the source is shown as a small black point. Where the difference is worse than 1.0'', the difference is shown by a red dot. The points are strongly clustered near the edges of the CCDs. | 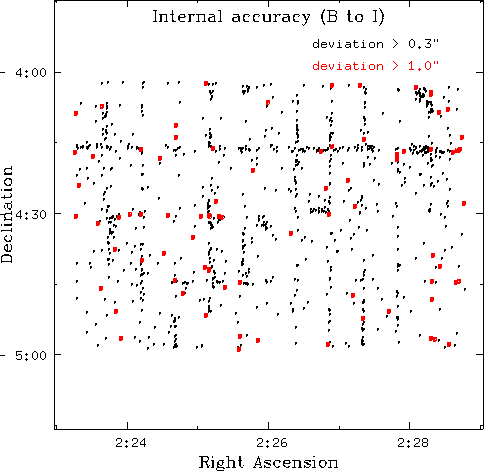 |
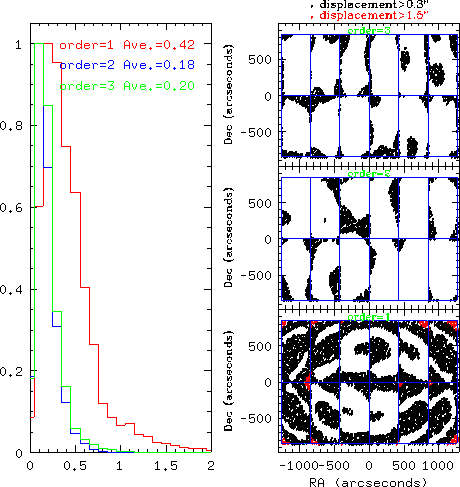
| Simulations have been performed to determine the expected accuracy of the photometry. In these simulations reference stars are dropped down at random on the focal plane. Their positions are adjusted in accordance with the known distortion of the CFHT prime focus. The positions of the stars are also given a random error, to simulate errors in the reference catalog. The CCD layout of the CFH12K camera is superimposed on the stars. For each CCD, a plate solution is determined. Stars in neighbouring CCD's are not considered. For each CCD, a 1000 new stars are then randomly placed to test the accuracy of the plate solution. The results are shown below. In each case, three orders of plate solution were tested: a linear fit, a quadratic and a cubic. |
| The figure at right shows the results of a simulating
the fit to the USNO catalog. Here 40 stars per CCD were used, each with
an error of 0.3''.
The figure at near right shows the distribution of the residuals. When the plate solution is computed to an order greater than second, the average residual is about 0.2''. The figure at far right shows the distribution on the CFH12K chip layout of the worst residuals. The stars with offsets greater than 0.3'' are shown as black. dots. Those with >1.5'' offsets are shown in red. There are no big offsets for the second and third order fits. |
 |
|
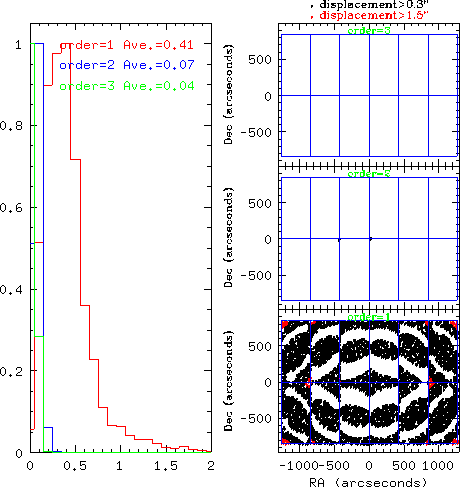
The internal (band-to-band) accuracy was also simulated.
In this case, many more sources were added (1000 per CCD).
The position error was held the same at 0.3'' per star.
The figures at right show the results of these simulations.
The figure at near right shows the distribution of the residuals. The figure at far right shows the position of greatly discrepant positions: The black dots show stars with positional errors greater than 0.3'' and the red dots show shifts greater than 1''. |
 |
| Conclusions: Something isn't working as well as it should. Either SExtractor isn't measuring the centres properly (ie. the error on the positions is larger than 0.3'') or something is sub-optimal in astrometrix. Alternatively there is another gross distortion beyond the wide-field corrector. Or possibly the USNO stars aren't as accurate as advertised. Possibly the fit is very sensitive to one misplaced star. |