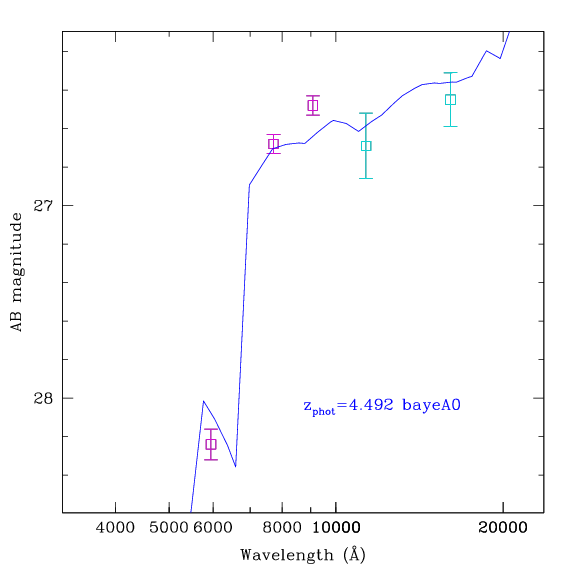
The figure at right shows the spectral energy distribution of the galaxy in question. It is plotted as AB magnitude vs. wavelength. Note that AB magnitude translates directly into flux per unit frequency, with the same conversion factor at all wavelengths. The points represent imaging data: Magenta points show the ACS optical data, the cyan points show the NICMOS IR data and black point show the ground based data, either from EIS or from ISAAC. The blue shows the best photometric redshift fit, as noted in the text on the figure.
Below you can see thumbnail images of the object in all 15 bands (you may need to scroll to see all of them). Each thumbnail image is 64 pixels (=5.75'') on a side. This object is near the edge of the original image, so it is not perfectly centred on the thumbnail images.


