NIRI data reductions

Summary:
This web page describes the "quick and dirty" reduction of NIRI+Altair data taken for the "Mergers, Morphology and Mass-buildup" (MMM) project as part of Gemini GN-2004B-Q-41 observations.

Reduction procedure


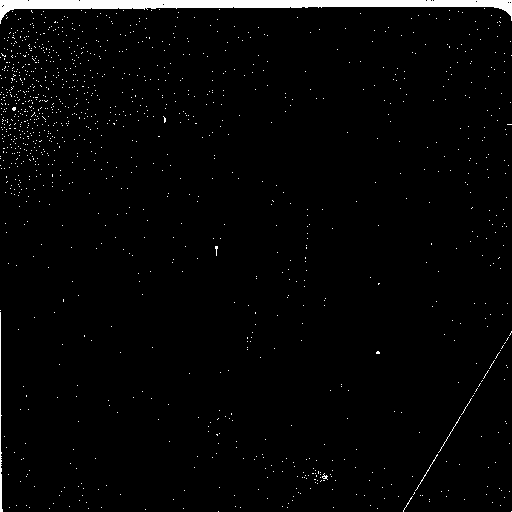
Make a mask: There are numerous cosmetic defects on the NIRI chip. To mask these, the all data images were examined in parallel. Any pixel with a value above or below certain threshold was deemed a hot pixel or a dead pixel This pixel was so flagged and discarded from future analyses. Note the pixels in the bright guide star are always above the high threshold, but because of the dithering pattern, it moves around. A pixel is deemed bad if it is too hot or too cold in more than 20% of the images. The mask is show at right; the FITS version can be downloaded here

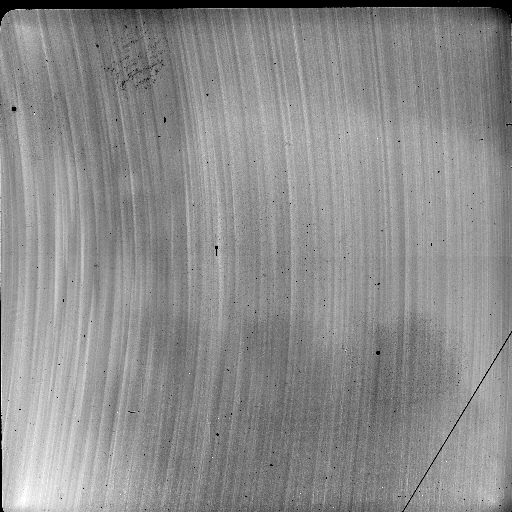
Make a flat: As part of the calibration package there were 20 lamp exposures, 10 with the shutter open, 10 with the shutter closed. The "open shutter" images were divided by their medians and the resulting image combined, again with a median. The same procedure was applied to the "closed shutter" images and the two resulting images were subtracted (open minus closed) both combined with a median and the results subtracted to make the flat field. The resulting flat field is shown at right; the FITS version can be downloaded here Each of the data images were divided by the flat field. The resulting FITS images can be found in this directory.

Make the fringe/scattered light map: This was done by subtracting the DC component from each of the data images (the median of all the un-masked pixels) and median-combining the results. The resulting fringe/scatter light map is shown at right; the FITS version can be downloaded here. This frame was this subtracted from each of the data images. The results can be seen in this directory.


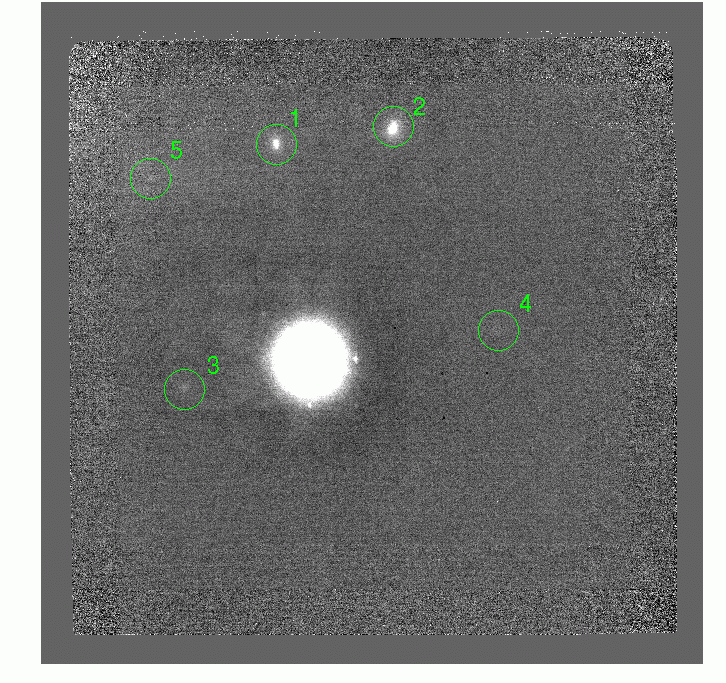
Combine the images: The relative shifts of the images were found by centering on the bright guide star. The pixels in the centre of the guide star are actually saturated. Gaussian fitting was used on the non-saturated pixels to find the centres. The results seem good to better than pixel. The images were shifted so that the guide star was aligned in each image (integral pixel shifts only). The sky background (which was steadily increasing over the image sequence) was removed from each image (again, the by finding the median of all the un-masked pixels). The images were combined with a 2-sigma clipped average. The result is shown at right. The FITS version can be downloaded here.


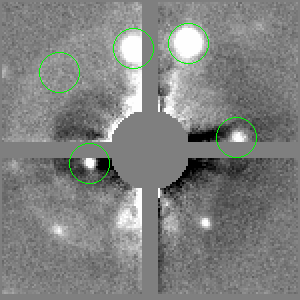
Results: Five galaxies can be found in the images, as shown in green above. All of these galaxies have optical counterparts. The PSF-subtracted I band image is shown at right. The FITS postage stamps in all 5 bands can be found in this directory


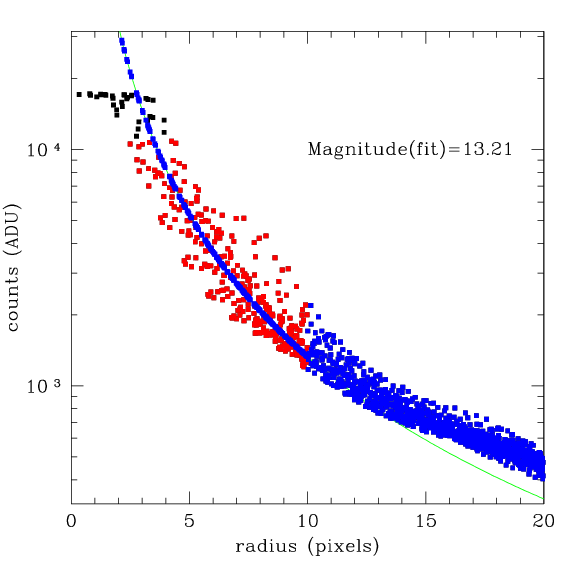
Photometry: The guide star is in the 2MASS catalog with a K magnitude of 11.374 in the Vega system. For the K-prime filter, the correction to AB is 1.834 magnitudes, so the star has K_AB=13.21. Because the central pixels of image of the star are saturated, we must interpolate from the wings to find the total flux. The figure at right shows the radial profile of the star the black points indicate the saturated pixels. The red points indicate points in the fitting radius and the scattered blue points indicate points outside the fitting radius. The green line indicates the fitting function, a Lorentzian. Within the fitting radius, the data is superceded by the fit, as indicated by the unscattered blue points. The best fit zero-point is 30.02, althought the details of the fitting process could change this by a few tenths of a magnitude. The IRAF photometry package was used to get magnitudes for the other objects in the frame. When measured through a 0.3 arcsecond (14 pixel) aperture radius we find:
GalaxyK_AB Err
1 21.780.03
2 21.020.02
3 24.090.10
4 24.860.16
5 24.270.13


Problems:

  • The two bright galaxies both have their axes pointing towards the guide star, indicating that they might lie outside the isoplanatic area. Unfortunately, PSF calibration images were not taken to verify this.
  • The signal to noise on the faintest galaxy is considerably worse than was anticipated.


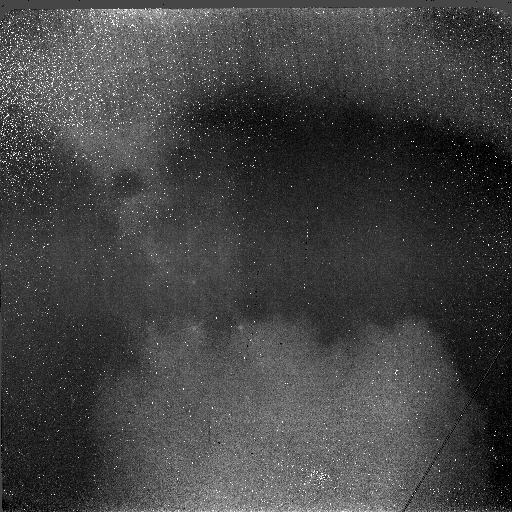
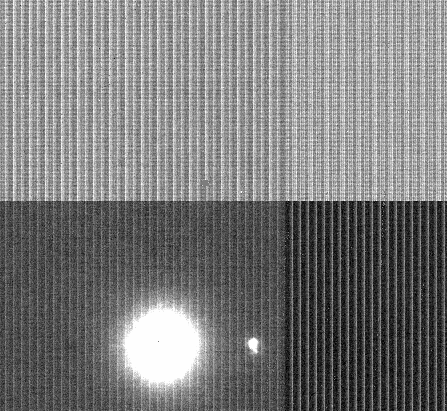
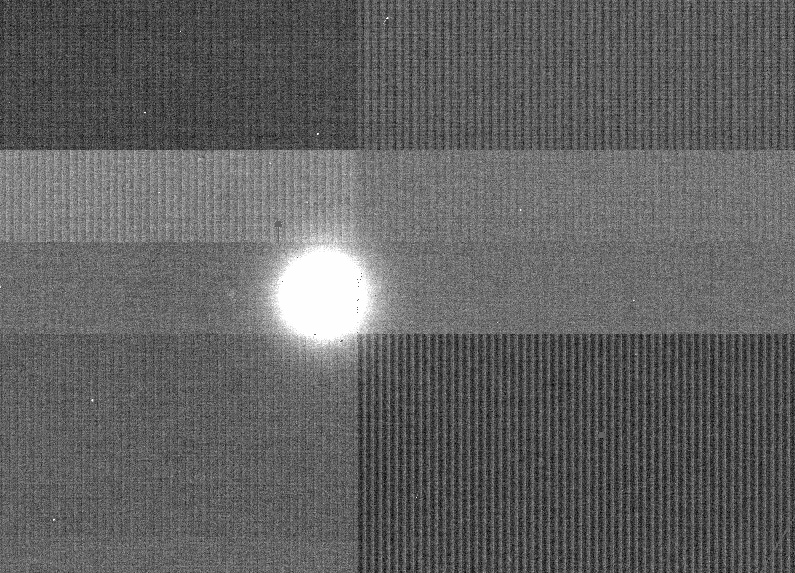
Questions: The background of many of the individual images show a grid structure which is not constant from image to image. An example is shown at top right: it is the central patch of image N20040822S0156.fits (flattened and de-fringed). (Click here for the FITS versions of the original image and the flattened and de-fringed images. The amplitude of the ridges is about 50 ADU on a sky background of 350 ADU. The shift in background level between the top and bottom half is also about 50 ADU. Almost all the images show this effect to some degree, although most images it is smaller (~10 ADU), see for example, the image at bottom right. The worst images seem to be when the telescope shifts from one dither postion to another. These images were discarded from the analysis above. Particularly bad images are:

Is this normal? At what level will it affect the final results?


Send comments/suggestions/problems to

gwyn@uvastro.phys.uvic.ca